Download
1 / 54
540 likes | 635 Vues
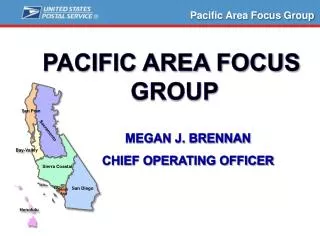
June 12, 2014. Northeast Area Focus Group. Northern New England. Albany. Greater Boston. Connecticut. Valley. Megan J. Brennan Chief Operating Officer. Westchester. Caribbean. Long Island. Northern New Jersey. New York. Triboro. Northeast Area Focus Group.

E N D
June 12, 2014 Northeast Area Focus Group Northern New England Albany Greater Boston Connecticut Valley Megan J. Brennan Chief Operating Officer Westchester Caribbean Long Island Northern New Jersey New York Triboro
Northeast Area Focus Group Thank You for Your Participation In This valuable process Value of the Area Mailer Industry Focus Groups: • Forum to Communicate Operational Changes • Provides a Forum for Crucial Feedback / Suggestions / Ideas • Builds Critical Relationships at All Levels of the Organization • Immediate Issue Resolution
Volume Universal Service Obligation • Transactional volume • declining due to e-diversion • Advertising mail is subject to more substitution options • Mail volume highly sensitive • to economic changes • Mail mix changes – lost profit contributions Postal network driven by: • Delivery points • Retail locations • Sortation facilities • Six-day delivery Price Labor Costs • ~80% of total costs • COLA increases • Benefits: pensions, retiree health, health insurance • Limited flexibility • Retiree prefunding obligation, rising workers’ compensation costs • Limited pricing flexibility Business Imperative for Change Declining steadily Fixed cost base These trends will continue to put pressure on USPS ability to provide affordable universal service Rising cost per hour Rising but capped
Continuous Efficiency Improvements Have Helped Mitigate the Impact of Business Threats $16 Billion of Annualized Savings in the past seven fiscal years with workhours reduced by 24% Despite Significant Cost Reductions Losses Remain At Unsustainable Levels Total Workhours (Millions) Savings (Billions) Career Employees – Reduced by 205K since 2006, without layoffs Postal Service is More Efficient Than Ever 800 30 696 685 24.2 663 Annual Growth 1.2% [2000 – 2013] 623 25 584 557 20 528 491 15 TFP Cumulative Trend 10 5 Annual Growth 0.3% [1972 – 1999] 0 '06 '07 '08 '09 '10 '11 '12 13 19721980199020002013
A Deep Financial Hole • Liabilities exceed assets by approx. $40 billion • The USPS has only 35 cents of assets to cover each dollar of its liabilities ASSETS LIABILITIES • * Newly available data on forever stamp usage resulted in a $1.3B reduction in Deferred Revenue – Prepaid Postage • ** Under multi-employer accounting rules, there are approximately $51B in obligations not shown on the balance sheet. • Significant profits over years and legislation are needed to recover.
USPS Business Plan Closing the Gap 2016 Savings • Legislative Initiatives $11.1B • Operational Initiatives $6.0 • Transforming Infrastructure • Continuous Improvement • Workforce $2.6B • Reduce the Unit Cost of labor • Increased Flexibility 6
Key Legislative Goals • Require USPS Health Care Plan • Resolves RHB Prefunding Issue • Refund FERS Overpayment • Adjust Delivery Frequency (6-Day Packages, 5-Day Mail) • Streamline Governance Model • Authority to Expand Products and Services • Require Defined Contribution System for Future Postal Employees • Instructions to Arbitrator • Reform Workers’ Compensation • Right to Appeal EEOC Class Action Decisions 7
Northeast Area Focus Group Delivery and Post Office Operations Transforming Infrastructure Facilities Retail Ops Network Operations 8
Network Rationalization NETWORK CAPACITY 1970 2014 2006 9
Plant Consolidations Processing Plant Consolidations 800 • Over 350 Facilities Eliminated • Reduced over 75M miles 673 700 623 614 599 600 528 487 500 461 417 400 320 300 Phase 1 200 10
Northeast Area Focus Group Delivery Optimization 11
Major Optimization Initiative Delivery Optimization Transforming Infrastructure • Units • 2,513 Delivery Unit Consolidated • Routes • 24,000 City Routes Reduced • Deliveries • Efficient Mode of Delivery 12
Delivery Mode Conversions Current Policy/Strategies are Driving Migration to More Efficient Delivery Mode USPS Delivery Modes FY 2013 Growth by Mode Fiscal Year 2013 FY 2013 Growth % Total CENTRAL DOOR Door (61.2K) (6%) 37.8M 40.5M Curbline 490.9K 47% 31% 28% Centralized 607.6K 59% CURBLINE 55.0M Total Growth 1.04M - - 41.0% Total street deliveries – 133.3M
Northeast Area Focus Group Access Optimization 14
Retail Strategy Retail Channel Strategy Focus • Grow Revenue • Reduce the Cost to Serve • Transform Customer Experience in High Traffic Post Offices • Enhance Customer Convenience Through Expanded • Retail Partnerships • Preserve Retail Services in Rural America • 50% of Post Offices realigned to match community needs
Northeast Area Focus Group Facilities management & Disposal 17
Facilities Optimization USPS Facilities New Jersey Network Distribution Center – 1.4M Sq Ft Owned 8,596 Leased 23,763 18 Ochopee FL Post Office – 62 Sq Ft
Facilities Optimization Objective • Generate Revenue and Reduce Expenses by: • Selling owned buildings • Terminating leases • Re-purposing space Over 6.7M Sq. Ft. Eliminated
Advantages of a Transformed Infrastructure • Fewer Facilities • Denser Bundles/Trays and Pallets • Increased Equipment Utilization • Increased Productivities • Maximized Transportation • Better Utilization of Air/Surface Trips • Gain Economies of Scale • Right-sized Workforce • Employee Flexibility • Revised Pay Structure Complement
Northeast Area Focus Group Major FY 2014 Initiative DSCF Standard Mail Load Leveling 21
Imbalance of Mail Delivered by DOW 45% Disproportionate amount of Standard Mail is scheduled for delivery on Monday resulting in: 40% • Service Variability 35% • Operational Inefficiencies • Increased Cost 30% 25% 20% 15% 10% 5% 0% SAT MON TUE WED THU FRI Postal Quarter 1 FY 13
Expected Days of Delivery SCOPE OF LIMITED CHANGE DELIVERY DAYS MEETING SERVICE STANDARD Thursday Friday, Saturday, Monday Friday, Saturday, Monday DSCF Standard Mail** Dropped Before 4pm* on Prior to April 10 Current Friday Saturday, Monday Saturday, Monday, Tuesday Saturday Monday, Tuesday Monday, Tuesday, Wednesday Sunday Monday, Tuesday, Wednesday Monday, Tuesday, Wednesday *The current Critical Entry Time (CET) for Standard mail is 4 pm **For delivery in the continental United States 23
Expected Days of Delivery What Hasn’t Changed • Standard mail dropped at a DDU does not change • Standard mail dropped at a NDC does not change • EDDM Retail does not change • Periodical/Newspaper processing does not change • First-Class does not change • Priority does not change 24
Delivered Volume % OF Total Delivered Volume by Day Baseline PERIOD DSCF Load Leveling to Date * * 4/19 through 6/6 25
Service Performance DSCF Standard Letters 4/12 – 5/23 Standard SCF Letters UCL / LCL UCL / LCL Target Target SPLY SPLY Standard SCF Flats DSCF Standard Flats 4/12 – 5/23 26
Standard DSCF Flats April 11 – May 30 Friday Start-the-Clock Day 1 – Saturday 23.82% Day 2 – Monday 53.99% Day 3 – Tuesday 19.00% Service Variance
DSCF Standard Mail Load Leveling • Results are Promising • Mail Processing working to capacity • Reducing average hours per route • Balanced workload with consistent service performance • Controls and Monitoring • Facility Audits • New data driven diagnostic reports • Address the Vital Few Opportunities • Operational Tiger Teams for site visits and improvement recommendations
Benefits • Benefit to Mailers and Customers • Predictable and Reliable Service • Consistent Delivery Times by Day of the Week • Less Competition in the Mailbox • Increase Visibility • Cost Containment – Maintain Affordable Prices 29
100% Visibility 100% Product Visibility Provides the ability to track mail pieces and containers through the postal network and provide business intelligence to enhance operational performance and provide customer value 30
Attributes of 100% Product Visibility Unique barcodes on letters, flats, packages, trays and containers Access to analytical capabilities for forecasting and predictive workloads Real-time Data & Intelligence 31
Next Generation Equipment Delivery Sortation System PASS Real-Time Scanners Mobile Delivery Device (Replaces Real-Time Scanners) C007 Dec 2012- March 2014 Nov 2012-Sept 2013 Feb-May 2013 Jul 2014-Dec 2014 Jan–Dec 2014 Deployment May-Nov 2014 Deployment Jan 2015 – Aug 2015 Scanning Units Scanning Units Scanning Units Scanning Units Scanning Units Scanning Units Scanning Units Total – 12,500 Total – 4,167 Total – 225,000 210,608 75,000 150,000 11,700 3,137 1,030 800 32
Delivery Management System (DMS) • Evaluates Carrier Route Status to plan and color-coded route status • Estimates Delivery Time for all packages in unit • Currently being tested in limited ZIP Codes 33
Predictable and Measureable HOW? Does USPShave the mail? Where is it in the process? When will itbe delivered? How did the overall mailing perform? An optimized plan for: Full Service Intelligent Mail Strategies Avoidingbottle necks Balance resources & reduce costs Response Rates & ROI Consistent, predictable delivery Business Intelligence Enhances the Performance& Value of Your Mailings 34
Northeast Area Focus Group Growth Opportunities 35
Growth Opportunities • Enhance the value of Direct Mail and Catalogs • Increase Marketshare of Packages • Innovate across USPS Business Platforms Continue to Optimize the Value of the Infrastructure 36
Mail is Relevant – Most Direct Way to Communicate 12%.....the share of total American marketing spend on mail. It’s been consistently about 12 percent for the past 30 years. • Four Key Ideas: • Personally Relevant – Interest • Actionable – Speed to purchase • Functional – Imbed technology in paper • Creative – Color, construction, size 37
Growing Direct Mail The Impact of Direct Mail is Significant Using direct mail and email in integrated campaigns creates synergies that boost response more than using either medium alone. Source: Marketing Sherpa Study 38
Mobile Commerce Mobile Technology Helping Drive Long-Term Value with Direct Mail and Catalogs. • Smartphones and tablets interact with the printed page • Direct Mail or Catalog becomes “catalyst” for mobile commerce • Direct Mail and Catalog integration with technology increases: • Relevance • Effectiveness • Convenience • Responsiveness • Engagement NFC Mobile Barcode Image Recognition Augmented Reality 39
Committed to Mail • We remain committed to growing mail • Will collaborate with the industry to grow and enhance direct mail and catalogs • Embrace technology to attract consumers to new possibilities • Continue to seek promotional ideas from customers The power of mail enhances package delivery & returns. 40
Growth Opportunity Opportunity in Packages Building a World Class Package Platform 41
E-Commerce Continues to Grow Rapidly Attain market share NOW grow with hyper-growth of market 42
Package Growth Opportunity Elements to Building a World Class Platform • Integrated Package Network Plan • Product Development Plan • Package Delivery Optimization Plan • Next Generation Equipment • International Package Processing Plan • Improve Customer Pick-up Experience • 100% Product Visibility SEVEN KEY ELEMENTS 43
Growth Opportunity Align Our Returns Portfolio with the Needs of Ecommerce Shippers Create a simpler returns product line • Consolidate disparate offerings to Network and First Mile Eliminate obstacles to onboarding • Fees • Separate permits Make products easier for users • Roundtrip label • Print and Deliver label • Expand customer base for Scan-based Payment
Customized Shipping Customized Products to Meet the Needs of Large Ecommerce Shippers Sunday Delivery • Leveraging Sunday delivery to grow our overall package business Parcel Select Next-Day • Next-day delivery for SCF-dropped packages (last mile and a half) MetroPost • Same-day, competitive-priced delivery • Talking with larger retailers with NYC introduction
Northeast Area Focus Group the Future is Now Innovation Platforms 47
Consumers’ busy lifestyles demand more delivery convenience These changes set new consumer expectations Growing Consumer Expectations New businesses take notice of these demands and offer more expedient deliveries Existing players improve their offerings to meet demand
Emerging Trends Directional patterns that may generate market, customer, or organizational needs or opportunities. Industry Developments shaping how businesses are organized and how transactions take place Social Patterns of human interaction,movement, and preference E-Commerce Simplicity Technology The application of scientific knowledge and engineering in the digital age Do-It-Yourself Consumer Same-Day Delivery Public-Private Partnerships Collaborative Consumption Automation Big Data 3D Printing 49
Innovate Across Business Platforms First Mile Physical Network Last Mile Digital • Expand delivery solutions • Capitalize on the expansion of E-commerce and technology • Optimize route flexibility and productivity • Boost the demand for mail and packages • Expand and simplify induction points • Integrate emerging digital, big data, and consumer trends to grow • Leverage USPS’s brand, trust, and reputation to drive profit • Leverage market-leading physical assets • Incorporate evolving logistics solutions • Develop a structure that fosters agility and innovation Optimizing the Value of the Infrastructure 50