Download
1 / 105
1.05k likes | 1.06k Vues
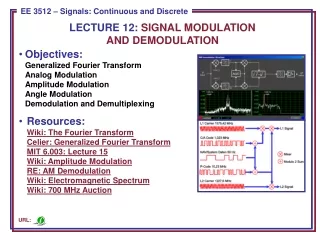
Lecture 1.6. Modulation. Bandpass Signalling Definitions Complex Envelope Representation Representation of Modulated Signals Spectrum of Bandpass Signals Power of Bandpass Signals Examples. Bandpass Signals.

E N D
Bandpass Signalling • Definitions • Complex Envelope Representation • Representation of Modulated Signals • Spectrum of Bandpass Signals • Power of Bandpass Signals • Examples
Bandpass Signals • Energy spectrum of a bandpass signal is concentrated around the carrier frequency fc. Bandpass Signal Spectrum • A time portion of a bandpass signal. Notice the carrier and the baseband envelope. Time Waveform of Bandpass Signal
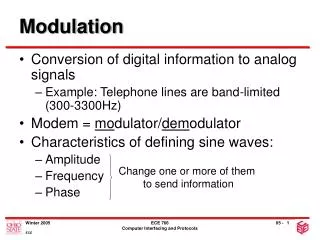
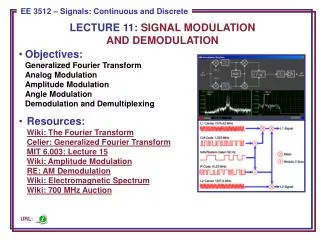
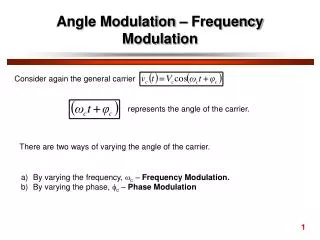
DEFINITIONS Signal processing Carrier circuits Transmission medium (channel) Carrier circuits Signal processing Information input m Communication System The Bandpass communication signal is obtained by modulating a baseband analog or digital signal onto a carrier. Definitions: • A baseband waveform has a spectral magnitude that is nonzero for frequencies in the vicinity of the origin ( f=0) and negligible elsewhere. • A bandpasswaveform has a spectral magnitude that is nonzero for frequencies in some band concentrated about a frequency where fc>>0. fc-Carrier frequency • Modulation is process of imparting the source information onto a bandpass signal with a carrier frequency fc by the introduction of amplitude or phase perturbations or both. • This bandpass signal is called the modulated signal s(t), and the baseband source signal is called the modulating signal m(t).
Complex Envelope Representation • The waveforms g(t) , x(t), R(t), and are all baseband waveforms. Additionally all of them except g(t) are real and g(t)is the Complex Envelope. • g(t)is the Complex Envelope of v(t) • x(t) is said to be the In-phase modulation associated with v(t) • y(t) is said to be the Quadrature modulation associated with v(t) • R(t) is said to be the Amplitude modulation (AM) on v(t) • (t) is said to be the Phase modulation (PM) on v(t) In communications, frequencies in the baseband signal g(t) are said to be heterodyned up to fc • THEOREM: Any physical bandpass waveformv(t) can be represented as below where fc is the CARRIER frequency and c=2 fc
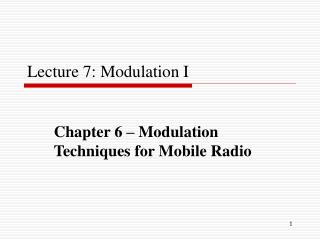
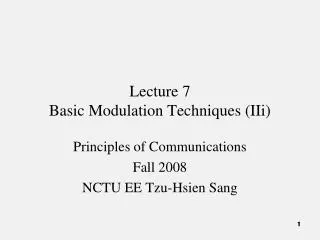
Generalized transmitter using the AM–PM generation technique.
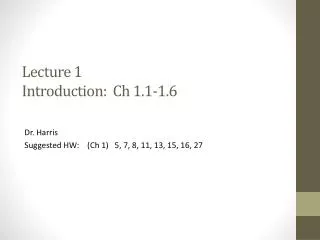
Generalized transmitter using the quadrature generation technique.
Complex Envelope Representation • THEOREM: Any physical bandpass waveformv(t) can be represented by where fc is the CARRIER frequency and c=2 fc PROOF: Any physical waveform may be represented by the Complex Fourier Series The physical waveform is real, and using , Thus we have: cn - negligible magnitudes for n in the vicinity of 0 and, in particular, c0=0 Introducing an arbitrary parameter fc , we get v(t) – bandpass waveform with non-zero spectrum concentrated near f=fc=> cn – non-zero for ‘n’ in the range => g(t) – has a spectrum concentrated near f=0 (i.e., g(t) - baseband waveform)
Inphase and Quadrature (IQ) Components. Envelope and Phase Components Complex Envelope Representation • Equivalent representations of the Bandpass signals: • Converting from one form to the other form
Complex Envelope Representation • The complex envelope resulting from x(t) being a computer generated voice signal and y(t) being a sinusoid. The spectrum of the bandpass signal generated from above signal.
Representation of Modulated Signals • Modulation is the process of encoding the source information m(t) into a bandpass signal s(t). Modulated signal is just a special application of the bandpass representation. The modulated signal is given by: • The complex envelope g(t) is a function of the modulating signal m(t) and is given by: g(t)=g[m(t)] where g[• ] performs a mapping operation on m(t). • The g[m]functions that are easy to implement and that will give desirable spectral properties for different modulations are given by the TABLE 4.1 • At receiver the inverse function m[g]will be implemented to recover the message. • Mapping should suppress as much noise as possible during the recovery.
Bandpass Signal Conversion 1 0 1 0 1 Xn g(t) Unipolar Line Coder X cos(ct) • On off Keying (Amplitude Modulation) of a unipolar line coded signal for bandpass conversion.
Bandpass Signal Conversion 1 0 1 0 1 Xn Polar Line Coder g(t) X cos(ct) • Binary Phase Shift keying (Phase Modulation) of a polar line code for bandpass conversion.
Spectrum of Bandpass Signals Where is PSD of g(t) Theorem: If bandpass waveform is represented by Proof: Thus, Using and the frequency translation property: We get,
PSD of Bandpass Signals • PSD is obtained by first evaluating the autocorrelation for v(t): Using the identity where and We get - Linear operators => or but AC reduces to PSD =>
Evaluation of Power Theorem: Total average normalized power of a bandpass waveform v(t) is Proof: But So, or But is always real So,
Example : Amplitude-Modulated Signal Complex envelope of an AM signal: Spectrum of the complex envelope: AM signal waveform: AM spectrum: • Evaluate the magnitude spectrum for an AM signal: Magnitude spectrum:
Example : Amplitude-Modulated Signal Spectrum of AM signal.
Example : Amplitude-Modulated Signal • Total average power:
Study Examples Fourier transform of m(t): Spectrum of AM signal: SA4-1.Voltage spectrum of an AM signal Properties of the AM signal are: g(t)=Ac[1+m(t)]; Ac=500 V; m(t)=0.8sin(21000t); fc=1150 kHz; Substituting the values of Ac and M(f), we have
Study Examples Thus Using PSD for an AM signal: SA4-2. PSD for an AM signal Autocorrelation for a sinusoidal signal (A sin w0t ) Autocorrelation for the complex envelope of the AM signal is
Study Examples Normalized PEP: SA4-3. Average power for an AM signal Normalized average power Alternate method: area under PDF for s(t) Actual average power dissipated in the 50 ohm load: SA4-4. PEP for an AM signal Actual PEP for this AM voltage signal with a 50 ohm load:
Bandpass Signalling • Bandpass Filtering and Linear Distortion • Bandpass Sampling Theorem • Bandpass Dimensionality Theorem • Amplifiers and Nonlinear Distortion • Total Harmonic Distortion (THD) • Intermodulation Distortion (IMD)
Bandpass Filtering and Linear Distortion • Equivalent Low-pass filter: Modeling a bandpass filter by using an equivalent low pass filter (complex impulse response) Bandpass filter H(f) = Y(f)/X(f) Input bandpass waveform Output bandpass waveform Impulse response of the bandpass filter Frequency response of the bandpass filter
Bandpass Filtering The complex envelopes for the input, output, and impulse response of a bandpass filter are related by Theorem: g1(t) – complex envelope of input k(t) – complex envelope of impulse response Also, Proof: Spectrum of the output is Spectra of bandpass waveforms are related to that of their complex enveloped But
Bandpass Filtering Thus, we see that Taking inverse fourier transform on both sides • Any bandpass filter may be described and analyzed by using an equivalent low-pass filter. • Equations for equivalent LPF are usually much less complicated than those for bandpass filters & so the equivalent LPF system model is very useful.
Linear Distortion For distortionless transmission of bandpass signals, the channel transfer function H(f) should satisfy the following requirements: • The amplitude response is constant A- positive constant • The derivative of the phase response is constant Tg – complex envelope delay Integrating the above equation, we get Are these requirements sufficient for distortionless transmission?
Linear Distortion The channel transfer function is If the input to the bandpass channel is Then the output to the channel (considering the delay Tg due to ) is Using Bandpass filter delays input info by Tg , whereas the carrier by Td Modulation on the carrier is delayed by Tg & carrier by Td
Bandpass Sampling Theorem Theorem: If a waveform has a non-zero spectrum only over the interval , where the transmission bandwidth BT is taken to be same as absolute BW, BT=f2-f1, then the waveform may be reproduced by its sample values if the sampling rate is Quadrature bandpass representation Let fc be center of the bandpass: x(t) and y(t) are absolutely bandlimited to B=BT/2 The sampling rate required to represent the baseband signal is Quadrature bandpass representation now becomes Where and samples are independent , two sample values are obtained for each value of n Overall sampling rate for v(t):
Bandpass Dimensionality Theorem • Assume that a bandpass waveform has a nonzero spectrum only over a frequency interval , where the transmission bandwidth BT is taken to be the absolute bandwidth given by BT=f2-f1 and BT<<f1. • The waveform may be completely specified over a T0-second interval by N Independent pieces of information. N is said to be the number of dimensions required to specify the information.
Received Signal Pulse Signal processing Carrier circuits Transmission medium (Channel) Carrier circuits Signal processing Information input m The signal out of the transmitter g(t) – Complex envelope of v(t) If the channel is LTI , then received signal + noise n(t) – Noise at the receiver input Signal + noise at the receiver input A – gain of the channel - carrier phase shift caused by the channel, Tg – channel group delay. Signal + noise at the receiver input
Nonlinear Distortion Non-linear Linear Amplifiers Circuits with memory and circuits with no memory Memory - Present output value ~ function of present input + previous input values - contain L & C No memory - Present output values ~ function only of its present input values. Circuits : linear + no memory – resistive ciruits - linear + memory – RLC ciruits (Transfer function)
Nonlinear Distortion Assume no memory Present output as a function of present input in ‘t’ domain • If the amplifier is linear K- voltage gain of the amplifier • In practice, amplifier output becomes saturated as the amplitude of the input signal is increased. output-to-input characteristic (Taylor’s expansion): Where - output dc offset level - 1st order (linear) term - 2nd order (square law) term
Nonlinear Distortion To the amplifier input Harmonic Distortion associated with the amplifier output: Let the input test tone be represented by Then the second-order output term is 2nd Harmonic Distortion with = In general, for a single-tone input, the output will be Vn – peak value of the output at the frequency nf0 The Percentage Total Harmonic Distortion (THD) of an amplifier is defined by
Nonlinear Distortion If the input (tone) signals are Intermodulation distortion (IMD) of the amplifier: Then the second-order output term is IMD Harmonic distortion at 2f1 & 2f2 Second-order IMD is:
Nonlinear Distortion Third order term is The second term (cross-product) is The third term is Intermodulation terms at nonharmonic frequencies For bandpass amplifiers, where f1 & f2 are within the pasband, f1 close to f2, the distortion products at 2f1+f2 and 2f2+f1 ~ outside the passband Main Distortion Products
Bandpass Circuits • Limiters • Mixers, Upconverters and Downconverters • Detectors, Envelope Detector, Product Detector • Phase Locked Loops (PLL)
Limiters • Limiter is a nonlinear circuit with an output saturation characteristic. • It rejects envelope variations but preserves the phase variations. Ideal limiter characteristic with illustrative input and unfilteredoutput waveforms.
Mixers • Ideal mixer is a mathematical multiplier of two input signals. One of the signals is sinusoidal generated by a local oscillator. Mixing results in frequency translation. SSB mixer
Choosing LO Frequency of Mixers Up-conversion Down-conversion Bandpass Filter Baseband/bandpass Filter (fc-f0) • If (fc- f0)= 0 Low Pass Filter gives baseband spectrum • If (fc- f0 )> 0 Bandpass filter Modulation is preserved Filter Output: • If fc>f0 modulation on the mixer input is preserved ‘’ needs to be positive • If fc<f0 Complex envelope is conjugated ~sidebands are exchanged
- Amplitude is scaled by A0/2 i.e., f0>fc down conversion with high-side injection - Amplitude is scaled by A0/2 - Sidebands are reversed from those on the input Mixers (Up Converter and Down Converter) • Complex envelope of an Up Converter: • Complex envelope of a Down Converter: i.e., f0<fc down conversion with low-side injection - Amplitude is scaled by A0/2
Mixer Realizations Without Multipliers • Multiplication operation needed by mixers can be obtained by using a nonlinear device together with a summer. Nonlinear device used as a mixer.
Mixer Realizations Without Multipliers • Multiplication operation needed by mixers can also be obtained by using an analog switch. Linear time-varying device used as a mixer.
Mixer Realizations Without Multipliers Analysis of a double-balanced mixer circuit.
Frequency Multiplier • Frequency Multipliers consists of a nonlinear device together with a tuned circuit. The frequency of the output is n times the frequency of the input.