Download
1 / 1
10 likes | 112 Vues
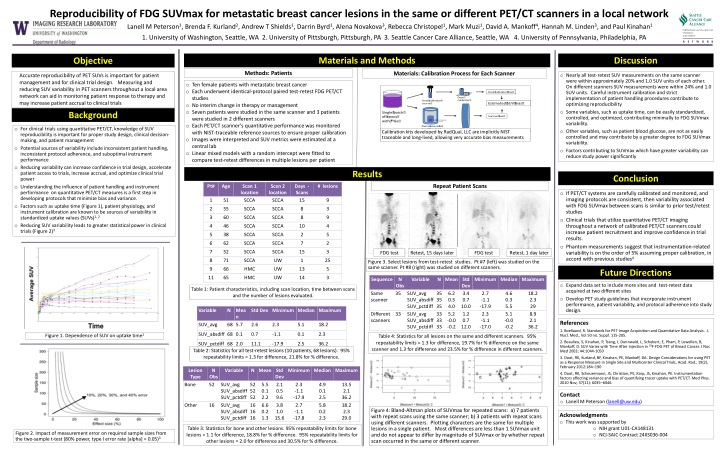
Reproducibility of FDG SUVmax for metastatic breast cancer lesions in the same or different PET/CT scanners in a local network.

E N D
Reproducibility of FDG SUVmax for metastatic breast cancer lesions in the same or different PET/CT scanners in a local network Lanell M Peterson1, Brenda F. Kurland2, Andrew T Shields1, Darrin Byrd1, Alena Novakova3, Rebecca Christopel1, Mark Muzi1, David A. Mankoff4, Hannah M. Linden3, and Paul Kinahan1 1. University of Washington, Seattle, WA 2. University of Pittsburgh, Pittsburgh, PA 3. Seattle Cancer Care Alliance, Seattle, WA 4. University of Pennsylvania, Philadelphia, PA Materials and Methods Discussion Objective Methods: Patients Materials: Calibration Process for Each Scanner Accurate reproducibility of PET SUVs is important for patient management and for clinical trial design. Measuring and reducing SUV variability in PET scanners throughout a local area network can aid in monitoring patient response to therapy and may increase patient accrual to clinical trials • Nearly all test-retest SUV measurements on the same scanner were within approximately 20% and 1.0 SUV units of each other. On different scanners SUV measurements were within 24% and 1.0 SUV units. Careful instrument calibration and strict implementation of patient handling procedures contribute to optimizing reproducibility • Some variables, such as uptake time, can be easily standardized, controlled, and optimized, contributing minimally to FDG SUVmax variability. • Other variables, such as patient blood glucose, are not as easily controlled and may contribute by a greater degree to FDG SUVmax variability. • Factors contributing to SUVmax which have greater variability can reduce study power significantly • Ten female patients with metastatic breast cancer • Each underwent identical-protocol paired test-retest FDG PET/CT studies • No interim change in therapy or management • Seven patients were studied in the same scanner and 3 patients were studied in 2 different scanners • Each PET/CT scanner’s quantitative performance was monitored with NIST-traceable reference sources to ensure proper calibration • Images were interpreted and SUV metrics were estimated at a central lab • Linear mixed models with a random intercept were fitted to compare test-retest differences in multiple lesions per patient Background • For clinical trials using quantitative PET/CT, knowledge of SUV reproducibility is important for proper study design, clinical decision-making, and patient management • Potential sources of variability include inconsistent patient handling, inconsistent protocol adherence, and suboptimal instrument performance • Reducing variability can increase confidence in trial design, accelerate patient access to trials, increase accrual, and optimize clinical trial power • Understanding the influence of patient handling and instrument performance on quantitative PET/CT measures is a first step in developing protocols that minimize bias and variance. • Factors such as uptake time (Figure 1), patient physiology, and instrument calibration are known to be sources of variability in standardized uptake values (SUVs)1, 2 • Reducing SUV variability leads to greater statistical power in clinical trials (Figure 2)3 Calibration kits developed by RadQual, LLC are implicitly NIST traceable and long-lived, allowing very accurate bias measurements Results Conclusion Repeat Patient Scans • If PET/CT systems are carefully calibrated and monitored, and imaging protocols are consistent, then variability associated with FDG SUVmax between scans is similar to prior test/retest studies • Clinical trials that utilize quantitative PET/CT imaging throughout a network of calibrated PET/CT scanners could increase patient recruitment and improve confidence in trial results. • Phantom measurements suggest that instrumentation-related variability is on the order of 5% assuming proper calibration, in accord with previous studies4 FDG test Retest, 15 days later FDG test Retest, 1 day later Figure 3. Select lesions from test-retest studies. Pt #7 (left) was studied on the same scanner. Pt #8 (right) was studied on different scanners. Future Directions • Expand data set to include more sites and test-retest data acquired at two different sites • Develop PET study guidelines that incorporate instrument performance, patient variability, and protocol adherence into study design. Table 1: Patient characteristics, including scan location, time between scans and the number of lesions evaluated. References 1. Boellaard, R. Standards for PET Image Acquisition and Quantitative Data Analysis. J. Nucl. Med., Vol 50 no. Suppl. 115-205. 2. Beaulieu, S, Kinahan, P, Tseng, J, Dunnwald, L, Schubert, E, Pham, P, Lewellen, B, Mankoff, D. SUV Varies with Time After Injection in 18F-FDG PET of Breast Cancer. J Nuc Med 2003; 44:1044-1050 3. Doot, RK, Kurland, BF, Kinahan, PE, Mankoff, DA. Design Considerations for using PET as a Response Measure in Single Site and Multicenter Clinical Trials, Acad. Rad., 19(2), February 2012:184–190 4. Doot, RK, Scheuermann, JS, Christian, PE, Karp, JS, Kinahan, PE. Instrumentation factors affecting variance and bias of quantifying tracer uptake with PET/CT. Med Phys. 2010 Nov; 37(11): 6035–6046. Figure 1. Dependence of SUV on uptake time1 Table 4: Statistics for all lesions on the same and different scanners. 95% repeatability limits = 1.3 for difference, 19.7% for % difference on the same scanner and 1.3 for difference and 23.5% for % difference in different scanners. Table 2: Statistics for all test-retest lesions (10 patients, 68 lesions). 95% repeatability limits = 1.3 for difference, 21.8% for % difference. • Contact • Lanell M Peterson (lanell@uw.edu) Figure 4: Bland-Altman plots of SUVmax for repeated scans: a) 7 patients with repeat scans using the same scanner; b) 3 patients with repeat scans using different scanners. Plotting characters are the same for multiple lesions in a single patient. Most differences are less than 1 SUVmax unit and do not appear to differ by magnitude of SUVmax or by whether repeat scan occurred in the same or different scanner. • Acknowledgments • This work was supported by • NIH grant U01-CA148131 • NCI-SAIC Contract 24XS036-004 Table 3: Statistics for bone and other lesions. 95% repeatability limits for bone lesions = 1.1 for difference, 18.8% for % difference. 95% repeatability limits for other lesions = 2.0 for difference and 30.5% for % difference. Figure 2. Impact of measurement error on required sample sizes from the two-sample t-test (80% power, type I error rate [alpha] = 0.05)3