Download
1 / 1
10 likes | 129 Vues
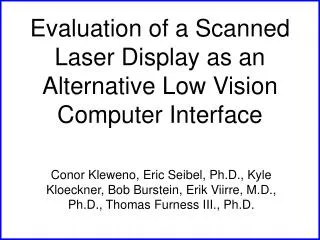
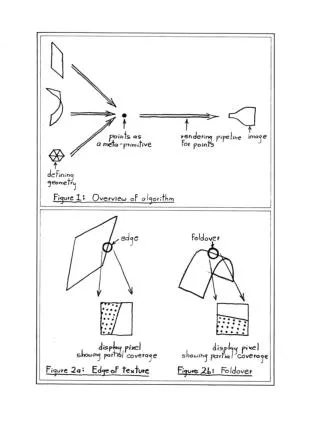
MRS scanner (x) mirror galvo (y). ( modulates intensity). DECREASED FLICKER SENSITIVITY WITH A SCANNED LASER DISPLAY. J.P. Kelly 1 , H.L. Pryor, E.S. Viirre, T. Furness III. 1 Children's Hospital & Medical Center; Human Interface Technology Lab; University of Washington; Seattle, WA.

E N D
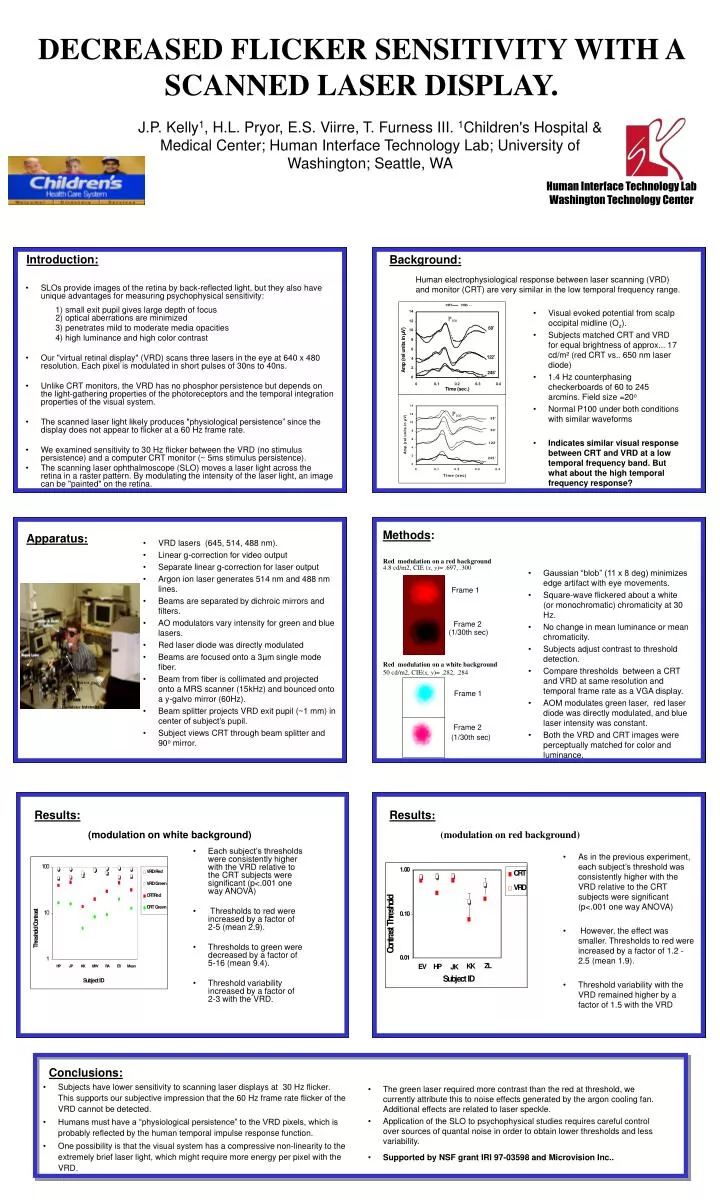
MRS scanner (x) mirror galvo (y) (modulates intensity) DECREASED FLICKER SENSITIVITY WITH A SCANNED LASER DISPLAY. J.P. Kelly1, H.L. Pryor, E.S. Viirre, T. Furness III. 1Children's Hospital & Medical Center; Human Interface Technology Lab; University of Washington; Seattle, WA Human Interface Technology Lab Washington Technology Center Introduction: Background:Human electrophysiological response between laser scanning (VRD) and monitor (CRT) are very similar in the low temporal frequency range. • SLOs provide images of the retina by back-reflected light, but they also have unique advantages for measuring psychophysical sensitivity: • 1) small exit pupil gives large depth of focus • 2) optical aberrations are minimized • 3) penetrates mild to moderate media opacities • 4) high luminance and high color contrast • Our "virtual retinal display" (VRD) scans three lasers in the eye at 640 x 480 resolution. Each pixel is modulated in short pulses of 30ns to 40ns. • Unlike CRT monitors, the VRD has no phosphor persistence but depends on the light-gathering properties of the photoreceptors and the temporal integration properties of the visual system. • The scanned laser light likely produces "physiological persistence” since the display does not appear to flicker at a 60 Hz frame rate. • We examined sensitivity to 30 Hz flicker between the VRD (no stimulus persistence) and a computer CRT monitor (~ 5ms stimulus persistence). • The scanning laser ophthalmoscope (SLO) moves a laser light across the retina in a raster pattern. By modulating the intensity of the laser light, an image can be "painted" on the retina. • Visual evoked potential from scalp occipital midline (Oz). • Subjects matched CRT and VRD for equal brightness of approx... 17 cd/m² (red CRT vs.. 650 nm laser diode) • 1.4 Hz counterphasing checkerboards of 60 to 245 arcmins. Field size =20o • Normal P100 under both conditions with similar waveforms • Indicates similar visual response between CRT and VRD at a low temporal frequency band. But what about the high temporal frequency response? P100 P100 Apparatus: Methods: • VRD lasers (645, 514, 488 nm). • Linear g-correction for video output • Separate linear g-correction for laser output • Argon ion laser generates 514 nm and 488 nm lines. • Beams are separated by dichroic mirrors and filters. • AO modulators vary intensity for green and blue lasers. • Red laser diode was directly modulated • Beams are focused onto a 3µm single mode fiber. • Beam from fiber is collimated and projected onto a MRS scanner (15kHz) and bounced onto a y-galvo mirror (60Hz). • Beam splitter projects VRD exit pupil (~1 mm) in center of subject’s pupil. • Subject views CRT through beam splitter and 90o mirror. Red modulation on a red background 4.8 cd/m2, CIE (x, y)= .697, .300 • Gaussian “blob” (11 x 8 deg) minimizes edge artifact with eye movements. • Square-wave flickered about a white (or monochromatic) chromaticity at 30 Hz. • No change in mean luminance or mean chromaticity. • Subjects adjust contrast to threshold detection. • Compare thresholds between a CRT and VRD at same resolution and temporal frame rate as a VGA display. • AOM modulates green laser, red laser diode was directly modulated, and blue laser intensity was constant. • Both the VRD and CRT images were perceptually matched for color and luminance. Frame 1 Frame 2 (1/30th sec) Red modulation on a white background 50 cd/m2, CIE(x, y)= .282, .284 Frame 1 Frame 2 (1/30th sec) Results: Results: (modulation on white background) (modulation on red background) • Each subject’s thresholds were consistently higher with the VRD relative to the CRT subjects were significant (p<.001 one way ANOVA) • Thresholds to red were increased by a factor of 2-5 (mean 2.9). • Thresholds to green were decreased by a factor of 5-16 (mean 9.4). • Threshold variability increased by a factor of 2-3 with the VRD. • As in the previous experiment, each subject’s threshold was consistently higher with the VRD relative to the CRT subjects were significant (p<.001 one way ANOVA) • However, the effect was smaller. Thresholds to red were increased by a factor of 1.2 - 2.5 (mean 1.9). • Threshold variability with the VRD remained higher by a factor of 1.5 with the VRD Ruler Conclusions: • Subjects have lower sensitivity to scanning laser displays at 30 Hz flicker. This supports our subjective impression that the 60 Hz frame rate flicker of the VRD cannot be detected. • Humans must have a “physiological persistence” to the VRD pixels, which is probably reflected by the human temporal impulse response function. • One possibility is that the visual system has a compressive non-linearity to the extremely brief laser light, which might require more energy per pixel with the VRD. • The green laser required more contrast than the red at threshold, we currently attribute this to noise effects generated by the argon cooling fan. Additional effects are related to laser speckle. • Application of the SLO to psychophysical studies requires careful control over sources of quantal noise in order to obtain lower thresholds and less variability. • Supported by NSF grant IRI 97-03598 and Microvision Inc..