Download
1 / 20
200 likes | 292 Vues
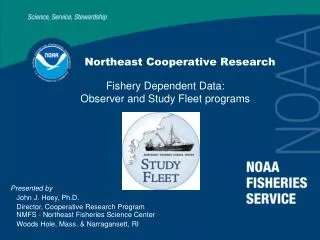
2012 MARACOOS Meeting Baltimore, MD. Northeast Cooperative Research. Fishery Data & Real Time Oceanographic Products --- “Fishermen, “Choke Species” and surviving endangered species act listings. Presented by John J. Hoey , Ph.D.

E N D
2012 MARACOOS Meeting Baltimore, MD Northeast Cooperative Research Fishery Data & Real Time Oceanographic Products --- “Fishermen, “Choke Species” and surviving endangered species act listings. • Presented by • John J. Hoey, Ph.D. • Director, Cooperative Research Program NMFS - Northeast Fisheries Science Center • Woods Hole, Mass. & Narragansett, RI
Cooperative Research Goals • Improve the data upon which fishery management decisions are made, • Foster coordination, cooperation, communication, and mutual respect among scientists, managers, and industry. • Scientific Objectives: • Improve precision of analytical stock assessments and address concerns about bias in sampling. • Fill Data Gaps. • Improve the temporal and spatial resolution of multi-species catch (haul based), gear performance, and life history data to support more timely analysis of a greater diversity of management options.
Fishery Independent Surveys Federal, State, and Industry Based Surveys complement each other. Increased interest in additional trawl and non-trawl surveys that explicitly consider habitat and ecosystem characteristics.
Fishery Dependent DataAnnual trip and haul observation totals for Observer and Study Fleet fishery dependent data 2011 Observer data – NEFOP thru August – ASM preliminary Sept - Dec
OBSERVER EFFORTS 2007-2011 N=81,030 SF EFFORTS 2007-2011 N=28,984
NE Study Fleet - Post-processing of GPS and temperature-depth data = x • By combining the GPS polling data with the TD probe data we can determine the location and timing of fishing effort from which the time-of-day, haul duration, haul location, distance fished, haul depth and water temperature can be determined.
A COMPARISON OF STUDY FLEET (SF) AND NEFOP/ASM OBSERVER COVERAGE IN COASTAL STATISTICAL AREA: 2008-Present
Comparison of total Study Fleet otter trawl hauls to Study Fleet hauls with Yellowtail flounder catch 2009. All study fleet hauls 2009 SNE & GEB Positive YTF hauls 2009 SNE& GEB
Analyzing haul specific data to support avoidance of ACL limited stocks
2009 2010 MAY 2011
2009 2010 JUNE 2011
2009 2010 JULY 2011
2009 2010 AUGUST 2011
Thoughts for consideration • Accuracy in terms of time and location provide leveraging opportunities for ecosystem data (tides, lunar cycles, etc.) which can improve the utility of maps and may better reflect fishermen’s local ecological - operational knowledge. • Observer data – Begin set – End haul – bottom temp observations are rare. • Study Fleet data – GPS polling and TD probes joined at 90 second intervals. • Data acquisition and QA/QC delays can be very significant. • Electronic logbooks can capture large volumes of haul specific data rapidly. • Turn-around time and map detail are critical system design issues. • More detailed information will support more detailed maps and other uses (e.g. discard estimation, Fishery dependent CPUE, sub-stock structure). Self-reported data quality must be verified. • A critical limitation or challenge for existing systems includes greater gear detail – relative to discard rates for new nets (accountability). • Industry likely interested in bottom temp forecasts at nautical sq mile spatial scales so that decisions on locations can avoid predicted hot spots for quota limited stocks.