Download

1 / 55
560 likes | 752 Vues
Segmentation (Section 10.3 & 10.4). CS474/674 – Prof. Bebis. Segmentation Approaches. Edge-based approaches Use the boundaries of regions to segment the image. Detect abrupt changes in intensity (discontinuities). Region-based approaches

E N D
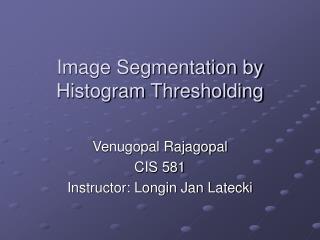
Segmentation (Section 10.3 & 10.4) CS474/674 – Prof. Bebis
Segmentation Approaches • Edge-based approaches • Use the boundaries of regions to segment the image. • Detect abrupt changes in intensity (discontinuities). • Region-based approaches • Use similarity among pixels to find different regions.
Main Approaches • Thresholding (i.e., pixel classification) • Region growing (i.e., splitting and merging) • Relaxation
Thresholding • The simplest approach to segment an image. If f (x, y) > T then f (x, y) = 0 else f (x, y) = 255
Automatic Thresholding • To make segmentation more robust, the threshold should be automatically selected by the system. • Knowledge about the objects, the application, the environment should be used to choose the threshold automatically. • Intensity characteristics of the objects • Size of the objects. • Fractions of an image occupied by the objects • Number of different types of objects appearing in an image
Thresholding Using Image Histogram • Regions with uniform intensity give rise to strong peaks in the histogram. • In general, a good threshold can be selected if the histogram peaks are tall, narrow, symmetric, and separated by deep valleys. T
Thresholding Using Image Histogram (cont’d) • Multiple thresholds are possible If f (x, y) < T1 then f (x, y) = 255 else if T1 < f (x, y) < T2 then f (x, y) = 128 else f (x, y) = 0 T2 T1
Hysteresis Thresholding • If there is no clear valley in the histogram of an image, then there are several background pixels that have similar gray level value with object pixels and vice versa. • Hystreresis thresholding (i.e., two thresholds, one at each side of the valley) can be used in this case. • Pixels above the high threshold are classified as object and below the low threshold as background. • Pixels between the low and high thresholds are classified as object only if they are adjacent to other object pixels.
Hysteresis Thresholding (cont’d) single threshold hysteresis thresholding
Using prior knowledge for segmentation:P-Tile method • This method requires knowledge about the area or size of the objects present in the image. • Assume dark objects against a light background. • If, the objects occupy p% of the image area, an appropriate threshold can be chosen by partitioning the histogram.
Optimal Thresholding • Suppose that an image contains only two principal regions (e.g., object and background). • We can minimize the number of misclassified pixels if we have some prior knowledge about the distributions of the gray level values that make up the object and the background. e.g., assume that the distribution of gray-level values in each region follows a Gaussian distribution.
Optimal Thresholding (cont’d) • The probability of a pixel value is then given by the following mixture (i.e., law of “total” probability): assuming Gaussian distributions:
pb(z) po(z) μo μb T Optimal Thresholding (cont’d) • Suppose we have chosen a threshold T, what is the probability of (erroneously) classifying an object pixel as background ?
pb(z) po(z) μo μb T Optimal Thresholding (cont’d) • What is the probability of (erroneously) classifying a background pixel as object ?
Optimal Thresholding (cont’d) Pb Po • Overall probability of error: • Minimize E(T) • The above expression is minimized when • Special cases when or μb μo
Optimal Thresholding (cont’d) • Main steps in choosing T
Optimal Thresholding (cont’d) • Drawbacks of the optimum thresholding method • Object/Background distributions might not be known. • Prior probabilities might not be known. object distribution superimposed on histogram optimal threshold thresholded image
Otsu’s Method • Assumptions • It does not depend on modeling the probability density functions. • It does assume a bimodal histogram distribution
Otsu’s Method • Segmentation is based on “region homogeneity”. • Region homogeneity can be measured using variance (i.e., regions with high homogeneity will have low variance). • Otsu’s method selects the threshold by minimizing the within-class variance.
Otsu’s Method (cont’d)Mean and Variance • Consider an image with L gray levels and its normalized histogram • P(i) is the normalized frequency of i. • Assuming that we have set the threshold at T, the normalized fraction of pixels that will be classified as background and object will be: T object background
Otsu’s Method (cont’d)Mean and Variance • The mean gray-level value of the background and the object pixels will be: • The mean gray-level value over the whole image (“grand” mean) is:
Otsu’s Method (cont’d)Means and Variances • The variance of the background and the object pixels will be: • The variance of the whole image is:
Otsu’s Method (cont’d)Within-class and between-class variance • It can be shown that the variance of the whole image can be written as follows: within-class variance should be minimized! between-class variance should be maximized!
Otsu’s Method (cont’d)Determining the threshold • Since the total variance does not depend on T, the T that minimizes will also maximize • Let us rewrite as follows: • Find the T value that maximizes where
Otsu’s Method (cont’d)Determining the threshold • Start from the beginning of the histogram and test each gray- level value for the possibility of being the threshold T that maximizes
Otsu’s Method (cont’d) • Drawbacks of the Otsu’s method • The method assumes that the histogram of the image is bimodal (i.e., two classes). • The method breaks down when the two classes are very unequal (i.e., the classes have very different sizes) • In this case, may have two maxima. • The correct maximum is not necessary the global one. • The method does not work well with variable illumination.
Effect of Illumination on Segmentation • How does illumination affect the histogram of an image?
Handling non-uniform illumination:a laboratory solution f (x, y) = i(x, y)r(x, y), • Suppose that where i(x, y) is non-uniform • Obtain an image of the illumination field. • e.g., project the illumination pattern on a surface with uniform reflectance (e.g., a white surface) • Normalize f(x,y) • If r(x, y) can be segmented using T, then h(x, y) can be segmented using T/k g(x, y) = k i(x, y) h(x, y) = f (x, y)/g(x, y) = r(x, y)/k
Handling non-uniform illumination:local thresholding • A single threshold will not work well when we have uneven illumination due to shadows or due to the direction of illumination. • Idea: • Partition the image into m x m subimages (i.e., illumination is likely to be uniform in each subimage). • Choose a threshold Tijfor each subimage.
Handing non-uniform illumination:local thresholding (cont’d) This approach might lead to subimages having simpler histogram (e.g., bimodal)
Handling non-uniform illumination:local thresholding (cont’d) single threshold local thresholding using Otsu’s method
Drawbacks of Thresholding • Threshold selection is not always straightforward. • Pixels assigned to a single class need not form coherent regions as the spatial locations of pixels are completely ignored. • Only hysteresis thresholding considers some form of spatial proximity.
Other Methods • Region Growing • Region Merging • Region Splitting • Region Splitting and Merging
Properties of region-based segmentation • Partition an image R into sub-regions R1, R2,..., Rn • Suppose P(Ri) is a logical predicate, that is, a property that the pixel values of region Risatisfy (e.g., the gray level values are between 100 and 120).
Properties of region-based segmentation (cont’d) • The following properties must hold true:
Region Growing • Region-growing approaches exploit the fact that pixels which are close together have similar gray values. • Start with a single pixel (seed) and add new pixels slowly
Region Growing (cont’d) Multiple regions can be grown in parallel using multiple seeds
Region Growing (cont’d) • How do we choose the seed(s) in practice ? • It depends on the nature of the problem. • If targets need to be detected using infrared images for example, choose the brightest pixel(s). • Without a-priori knowledge, compute the histogram and choose the gray-level values corresponding to the strongest peaks
Region Growing (cont’d) • How do we choose the similarity criteria (predicate)? • The homogeneity predicate can be based on any characteristic of the regions in the image such as: • average intensity • variance • color • texture
Region Merging • Region merging operations eliminate false boundaries and spurious regions by merging adjacent regions that belong to the same object. • Merging schemes begin with a partition satisfying condition (4) (e.g., regions produced using thresholding). • Then, they proceed to fulfill condition (5) by gradually merging adjacent image regions.
How to determine region similarity? (1)Based on the gray values of the regions – examples: • Compare their mean intensities. • Use surface fitting to determine whether the regions may be approximated by one surface. • Use hypothesis testing to judge the similarity of adjacent region (2)Based on the weakness of boundaries between the regions.
R2 R1 Region merging using hypothesis testing • This approach considers whether or not to merge adjacent regions based on the probability that they will have the same statistical distribution of intensity values. • Assume that the gray-level values in an image region are drawn from a Gaussian distribution • Parameters can be estimated using sample mean/variance:
R2 R1 Region merging using hypothesis testing (cont’d) • Given two regions R1 and R2 with m1 and m2 pixels respectively, there are two possible hypotheses: H0: Both regions belong to the same object. The intensities are all drawn from a single Gaussian distribution N(μ0, σ0) H1: The regions belong to different objects. The intensities of each region are drawn from separate Gaussian distributions N(μ1, σ1) and N(μ2, σ2)
Region merging using hypothesis testing (cont’d) • The joint probability density under H0, assuming all pixels are independently drawn, is given by: • The joint probability density under H1 is given by
R2 R1 Region merging using hypothesis testing (cont’d) • The likelihood ratio is defined as the ratio of the probability densities under the two hypotheses: • If the likelihood ratio is below a threshold value, there is strong evidence that there is only one region and the two regions may be merged.
Region merging by removing weak edges • The idea is to combine two regions if the boundary between them is weak. • A weak boundary is one for which the intensities on either side differ by less than some threshold. • The relative lengths between the weak boundary and the region boundaries must be also considered.
Region merging by removing weak edges (cont’d) • Approach 1: merge adjacent regions R1 and R2 if where: Wis the length of the weak part of the boundary S = min(S1, S2) is the minimum of the perimeter of the two regions.
Region merging by removing weak edges (cont’d) • Approach 2: Merge adjacent regions R1 and R2 if where: Wis the length of the weak part of the boundary Sis the common boundary between R1 and R2.