Download
1 / 1
10 likes | 88 Vues
SUNY Oswego LMC Cepheid Variables PL Relation in IR J. Bennett, D. Citro, J. Chartrand , S. Kanbur , C. Ngcow , L. Macri , S. Mahzooni , F. Ripple Physics Department, SUNY Oswego, National Central University Taiwan, and Texas A&M University. Abstract:

E N D
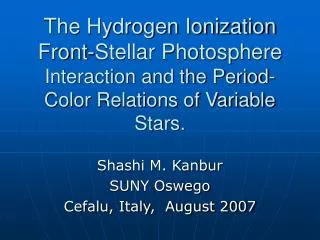
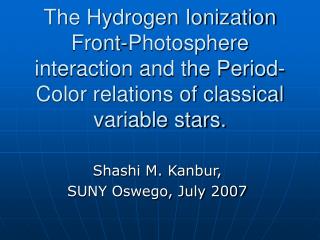
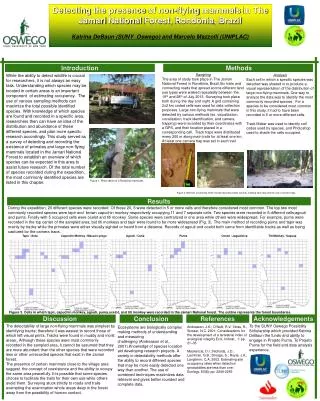
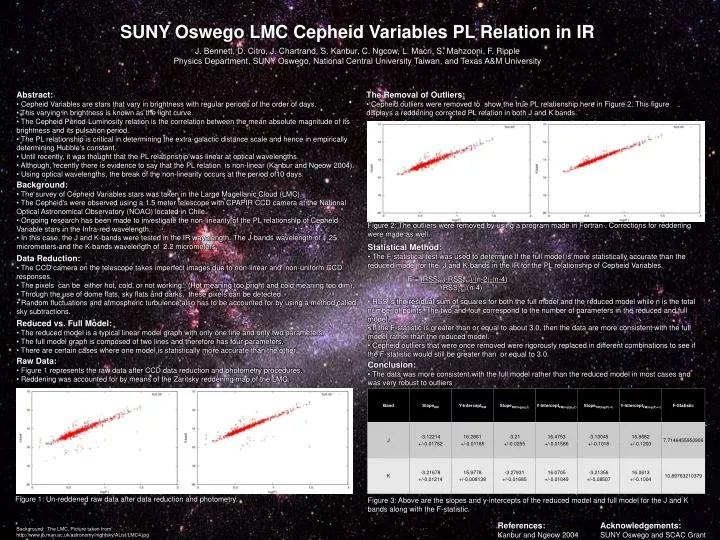
SUNY Oswego LMC Cepheid Variables PL Relation in IR J. Bennett, D. Citro, J. Chartrand, S. Kanbur, C. Ngcow, L. Macri, S. Mahzooni, F. Ripple Physics Department, SUNY Oswego, National Central University Taiwan, and Texas A&M University • Abstract: • Cepheid Variables are stars that vary in brightness with regular periods of the order of days. • This varying in brightness is known as the light curve. • The Cepheid Period-Luminosity relation is the correlation between the mean absolute magnitude of its brightness and its pulsation period. • The PL relationship is critical in determining the extra-galactic distance scale and hence in empirically determining Hubble’s constant. • Until recently, it was thought that the PL relationship was linear at optical wavelengths. • Although, recently there is evidence to say that the PL relation is non-linear (Kanbur and Ngeow 2004). • Using optical wavelengths, the break of the non-linearity occurs at the period of10 days. • The Removal of Outliers: • Cepheid outliers were removed to show the true PL relationship here in Figure 2. This figure displays a reddening corrected PL relation in both J and K bands. • Background: • The survey of Cepheid Variables stars was taken in the Large Magellanic Cloud (LMC). • The Cepheid's were observed using a 1.5 meter telescope with CPAPIR CCD camera at the National Optical Astronomical Observatory (NOAO) located in Chile. • Ongoing research has been made to investigate the non-linearity of the PL relationship of Cepheid Variable stars in the Infra-red wavelength.. • In this case, the J and K-bands were tested in the IR wavelength. The J-bands wavelength of 1.25 micrometers and the K-bands wavelength of 2.2 micrometers. Figure 2: The outliers were removed by using a program made in Fortran . Corrections for reddening were made as well. • Statistical Method: • The F-statistical test was used to determine if the full model is more statistically accurate than the reduced model for the J and K-bands in the IR for the PL relationship of Cepheid Variables. • F = (RSSRM-RSSFM)/(n-2)-(n-4) • RSSFM/(n-4) • RSS is the residual sum of squares for both the full model and the reduced model while n is the total number of points. The two and four correspond to the number of parameters in the reduced and full model. • If the F-statistic is greater than or equal to about 3.0, then the data are more consistent with the full model rather than the reduced model. • Cepheid outliers that were once removed were rigorously replaced in different combinations to see if the F-statistic would still be greater than or equal to 3.0. • Data Reduction: • The CCD camera on the telescope takes imperfect images due to non-linear and non-uniform CCD responses. • The pixels can be either hot, cold, or not working.. (Hot meaning too bright and cold meaning too dim). • Through the use of dome flats, sky flats and darks, these pixels can be detected. • Random fluctuations and atmospheric turbulence also has to be accounted for by using a method called sky subtractions. • Reduced vs. Full Model: • The reduced model is a typical linear model graph with only one line and only two parameters. • The full model graph is composed of two lines and therefore has four parameters. • There are certain cases where one model is statistically more accurate than the other. • Raw Data: • Figure 1 represents the raw data after CCD data reduction and photometry procedures. • Reddening was accounted for by means of the Zaritsky reddening map of the LMC. • Conclusion: • The data was more consistent with the full model rather than the reduced model in most cases and was very robust to outliers Figure 1: Un-reddened raw data after data reduction and photometry. Figure 3: Above are the slopes and y-intercepts of the reduced model and full model for the J and K bands along with the F-statistic. References: Kanbur and Ngeow 2004 Acknowledgements: SUNY Oswego and SCAC Grant Background: The LMC. Picture taken from http://www.jb.man.ac.uk/astronomy/nightsky/AList/LMC4.jpg