Download
1 / 24
240 likes | 246 Vues
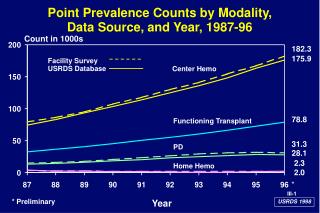
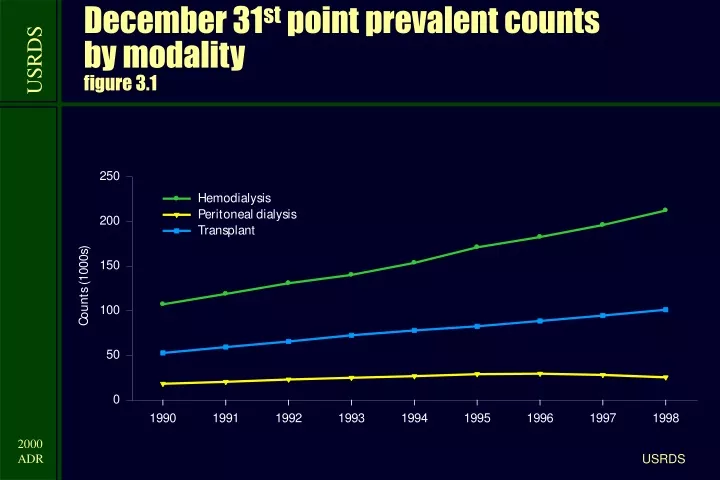
This analysis examines the trends in dialysis and transplant modalities among ESRD patients based on USRDS data from 1990 to 1998. It includes statistics on the number of patients, prevalence rates, and changes over time.

E N D
December 31st point prevalent counts by modalityfigure 3.1 USRDS
Number of dialysis patientsfigure 3.2, projected to 2010 USRDS
Number of transplant patients & patients on the transplant waiting listfigure 3.3, projected to 2010 USRDS
Modality at initiation, one year, & two yearsfigure 3.4, incident patients USRDS
December 31st point prevalence: Hemodialysis, 1990figure 3.5, percent of total patients Percent of total patients USRDS
December 31st point prevalence: Hemodialysis, 1994figure 3.5, percent of total patients Percent of total patients USRDS
December 31st point prevalence: Hemodialysis, 1998figure 3.5, percent of total patients Percent of total patients USRDS
December 31st point prevalence: Hemodialysis, percent change 1990-1998figure 3.5 Percent change USRDS
December 31st point prevalence: Peritoneal dialysis, 1990figure 3.5, percent of total patients Percent of total patients USRDS
December 31st point prevalence: Peritoneal dialysis, 1994figure 3.5, percent of total patients Percent of total patients USRDS
December 31st point prevalence: Peritoneal dialysis, 1998figure 3.5, percent of total patients Percent of total patients USRDS
December 31st point prevalence: Peritoneal dialysis, percent change 1990-1998figure 3.5 Percent change USRDS
December 31st point prevalence: Transplant, 1990figure 3.5, percent of total patients Percent of total patients USRDS
December 31st point prevalence: Transplant, 1994figure 3.5, percent of total patients Percent of total patients USRDS
December 31st point prevalence: Transplant, 1998figure 3.5, percent of total patients Percent of total patients USRDS
December 31st point prevalence: Transplant, percent change 1990-1998figure 3.5 Percent change USRDS
Modality by age group & genderfigure 3.6, point prevalent patients on December 31st, 1998 USRDS
Modality by race & genderfigure 3.6, point prevalent patients on December 31st, 1998 USRDS
Modality by primary diagnosis & genderfigure 3.6, December 31st point prevalent patients, 1998 USRDS
Modality at two years after first ESRD service, by age groupfigure 3.7, incident patients, 1994-1998 USRDS
Percent distribution of patients by modality, age group, gender, race, & primary diagnosistable 3.1, December 31st point prevalent patients, 1998 USRDS
Percent distribution of patients by treatment modality & networktable 3.2, December 31st point prevalent patients, 1996-1998 USRDS
Percent of ESRD patients, by modality & ESRD durationfigure 3.8, December 31st point prevalent patients, 1998 USRDS
Median age & modalityfigure 3.9, December 31st point prevalent patients, 1998 USRDS