Download
1 / 30
300 likes | 307 Vues
Load-Unload Response Ratio (LURR), Accelerating Moment/Energy Release (AM/ER) and State Vector Xiang-chu YIN 1,2 , Huai-zhong YU 1 , Victor Kukshenko 3, Zhaoyong XU 5 , Zhishen WU 4 , Meng-fen XIA 1,6 , Min LI 2 , Ke-yin PEN 1,2 and Surguei Elizarov 7

E N D
Load-Unload Response Ratio (LURR), Accelerating Moment/Energy Release (AM/ER) and State Vector Xiang-chu YIN1,2, Huai-zhong YU1, Victor Kukshenko3, Zhaoyong XU5, Zhishen WU4, Meng-fen XIA1,6, Min LI2, Ke-yin PEN1,2 and Surguei Elizarov 7 1, LNM (State Key Laboratory of Nonlinear Mechanics), IM, CAS 2, CAP (Center for Analysis and Prediction), CSB (China Seismological Bureau ) 3, Ioffe Physical Technique Institute, Russian Academy of Sciences 4, Ibaraki University, Japan 5, Yunnan Province Seismological Bureau, CSB 6, Peking University 7, Interunis Ltd, Moscow, Russia
TheCPH (Critical Point Hypothesis) considers earthquake rupture as a critical point( VERE-JONES, 1977; SORNETTE and SORNETTE, 1990; SORNETTE and SAMMIS 1995; BOWMAN et al, 1998; RUNDLE et al, 1999; JAUME and SYKES,1999). According to CPH the crust is not in a continuous critical state, but repeatedly approaches to and retreats from a critical state.
During the establishment of criticality the crust must be characterized by both: A. strong correlation between its different parts. B. susceptibility to external factors ..
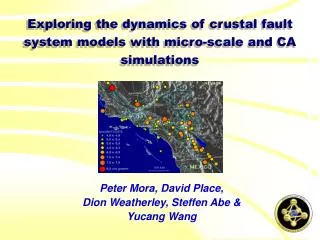
A. strong correlation establishment of long-range correlations in the regional stress field(SYKES, and JAUME 1990; RUNDLE et al, 1999; SAMMIS, and SMITH, 1999; MORA and PLACE, 2001). accelerating seismic activity of moderate-sized earthquakes(ELLSWORTH et al. 1981; KEILIS-BOROK, 1990; SORNETTE and SORNETTE, 1990; SORNETTE and SAMMIS; 1995; KNOPOFF, et al. 1996) and BOWMAN et al., 1998). equivalently the accelerating seismic moment release(time-to-failure power law)--AMR/AER(BUFE and VARNES, 1993; BOWMAN et al., 1998: JAUME and SYKES, 1999)prior to large earthquakes.
B. sensitivity to external factors (Xia et al.,2000 ) triggering earthquakes significantly by tidal stress(GRASSO and SORNETTE, 1998). consequently anomalous high value LURR(Load/Unload response Ratio) (YIN and YIN, 1991; YIN et al., 1994; YIN et al., 1995;YIN et al., 2000).
B. sensitivity to external factors (Xia et al, 2000) triggering earthquakes significantly by tidal stress(GRASSO and SORNETTE, 1998). consequently anomalous high value LURR(Load/Unload response Ratio) (YIN and YIN, 1991; YIN et al., 1994; YIN et al., 1995;YIN et al., 2000).
AMR/AER and LURRhave been tested with seismological observations bydifferent research groups. In the present work we will testLURR andAMR/AERwith the data ofacoustic emission (AE)during the rock fracture experiments since there are striking resemblances betweenacoustic emission (AE)andearthquakes.
A series of experiments with rectangular prisms of gneiss, sandstone and marble have been conducted. The geometry of the large specimens are 105Χ40 Χ 10cm3 small 7 Χ7 Χ14 cm3
P1 P2 P2 P1 The specimen is loaded in two directions: the axial stress σ1 and lateral stress σ2 . Another principal stressσ3 is zero so that: σ1≠σ2≠σ3. the stress state is really a tri-axial stress state. Under such stress state most of the specimens are failure in shear fracture way.
The loading history : monotonously loading cycling loading
Experiment Results AE Rate
LURR LURR is defined as: Where E denotes AE energy; sign “+” means loading and “–” means unloading. When m=1, Em is exactly the energy itself; m=1/2, Em denotes the Benioff strain.
Typically the Y-t curve is like that of below: The LURR anomaly prior to the Kobe earthquake and the Tottori earthquake.
The AE data confirms that prior to the fracture of rock sample LURR rises significantly and then it falls down at the eve of fracture so that a high value of LURR could be a precursor of the occurrence of macro-fracture or strong earthquake.
AER (Accelerating Energy Release ) The energy or Benioff strain release have the function form as below:
Gneiss 1 G 1
The experimental results suggest that during a period before the macro- fracture the AER really occurred.
State vector State vector is an idea stemming from statistical physics. Here it is used to describe the evolution of damage in rock specimen.
1 2 i N N-1 The whole specimen can be divided into N regions. A specified physical parameter concerned the micro-damage (say AE energy or AE rate etc) in region i at time tkdenotes the i-th component of a N-dimension vector called state vectorVk(t).
vectors Vk at different times tk form a track in the phase space. The track could be a tool to describe the damage evolution of the specimen. x3 V23 V3 V12 V2 12 V1 o x2 x1 State vector Vk at time tk is a point in the N-dimension phase space. Different state
e.g. the angle φ12 or Vk mirror the variation of damage pattern from V1 to V2 respectively.
Before the fracture of the specimen φ12has a significant rising which may be a clue to prediction of the macro-fracture or earthquake. logE
yyyy mm dd twin/a step/d scope cell lati longi 1975 2 4 1 15 8 1 40.70 122.70 Haicheng EQ
Summary The LURR and the AER (hence the critical point hypotheses) are confirmed with our experimental results and the state vector could be a novel measurement to describe the damage evolution or the seismogenic process for a specified region.