Download
1 / 1
10 likes | 131 Vues
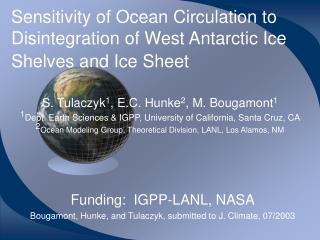
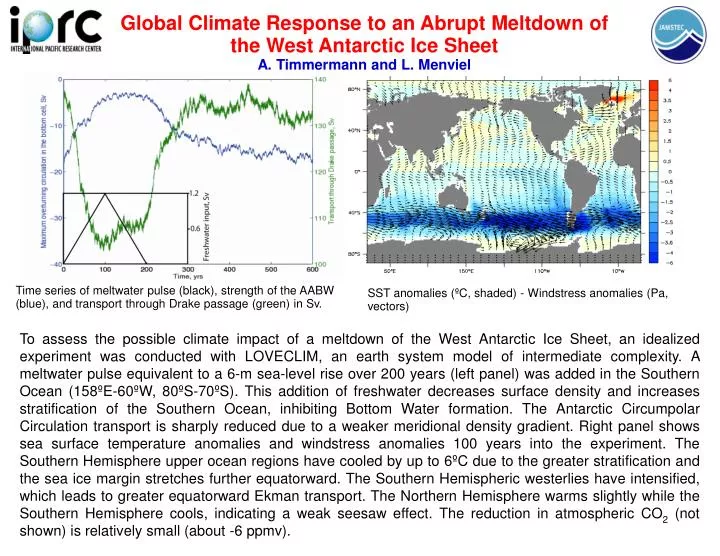
Global Climate Response to an Abrupt Meltdown of the West Antarctic Ice Sheet A. Timmermann and L. Menviel. Time series of meltwater pulse (black), strength of the AABW (blue), and transport through Drake passage (green) in Sv.

E N D
Global Climate Response to an Abrupt Meltdown of the West Antarctic Ice Sheet A. Timmermann and L. Menviel Time series of meltwater pulse (black), strength of the AABW (blue), and transport through Drake passage (green) in Sv. SST anomalies (ºC, shaded) - Windstress anomalies (Pa, vectors) To assess the possible climate impact of a meltdown of the West Antarctic Ice Sheet, an idealized experiment was conducted with LOVECLIM, an earth system model of intermediate complexity. A meltwater pulse equivalent to a 6-m sea-level rise over 200 years (left panel) was added in the Southern Ocean (158ºE-60ºW, 80ºS-70ºS). This addition of freshwater decreases surface density and increases stratification of the Southern Ocean, inhibiting Bottom Water formation. The Antarctic Circumpolar Circulation transport is sharply reduced due to a weaker meridional density gradient. Right panel shows sea surface temperature anomalies and windstress anomalies 100 years into the experiment. The Southern Hemisphere upper ocean regions have cooled by up to 6ºC due to the greater stratification and the sea ice margin stretches further equatorward. The Southern Hemispheric westerlies have intensified, which leads to greater equatorward Ekman transport. The Northern Hemisphere warms slightly while the Southern Hemisphere cools, indicating a weak seesaw effect. The reduction in atmospheric CO2 (not shown) is relatively small (about -6 ppmv).