Download
1 / 39
390 likes | 515 Vues
Visual Query: Mao Lin Huang. September 16, 2005. Dynamic Queries. Selecting value ranges of variables via controls with real time feedback in the display. Principles: Visual presentation of query’s components Visual presentation of results

E N D
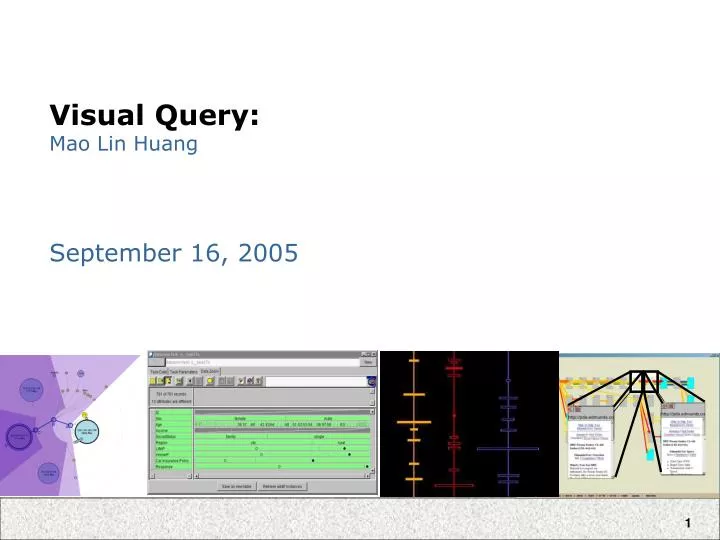
Visual Query: Mao Lin Huang September 16, 2005
Dynamic Queries Selecting value ranges of variables via controls with real time feedback in the display • Principles: • Visual presentation of query’s components • Visual presentation of results • Rapid, incremental, and reversible control • Selection by pointing, not typing • Immediate and continuous feedback • Support browsing • Details on demand
Dynamic Queries Tight coupling • Query components are interrelated in ways that preserve display invariants, reveal state of system • Output of queries can be easily used as input to produce other queries. Eliminate distinction between commands/queries/input and results/tables/output Example: Interactive Scatterplots • Multiple Names: Starfield, IVEE, Spotfire, HomeFinder
Example Devise: Jobs to Skill Matching
Texture Query 800 Web Mall – A typical example of traditional texture product catalog for online e-business that provides buyers with a series of textual lists placed in separate pages for navigation. Each list in a page shows only one level of the product hierarchy.
Examples DynaMapCervical cancer rates from 1950-1970 - modify year, state, demographics Slide adapted from Sarah Waterson
Examples http://www.caida.org/tools/visualization/mapnet/Backbones/
Animation • “Thequality or condition of being alive, active, spirited, or vigorous” (dictionary.com) • “A dynamic visual statement that evolves through movement or change in the display” • “… creating the illusion of change by rapidly displaying a series of single frames” (Roncarelli 1988). Slide by Saifon Obromsook & Linda Harjono
We Use Animation to… • Tell stories / scenarios: cartoons • Illustrate dynamic process / simulation • Create a character / an agent • Navigate through virtual spaces • Draw attention • Delight Slide by Saifon Obromsook & Linda Harjono
Animation Examples • Secret Lives of Numbers Viz • http://www.turbulence.org/Works/nums/applet.html
Cartoons in UIs http://www.ok-cancel.com/archives/week_2004_02_06.html
Cartoon-Style Animation • Main Reference • Chang & Unger, Animation: From Cartoons to the User Interface, UIST ’93 • Main ideas • Visual change in the interface can be sudden and unexpected • User can lose track of causal connection between events • Classic example: closing/opening windwos • This is now remedied via animation in standard windows interfaces • People have no trouble understanding transitions in animated cartoons • They grow and deform smoothly • They provide visual cues of what is happening before, during, and after a transition.
Cartoon Animation in User Interface Design • User Cartooning Principles to Enhance Animations • Replace sudden transitions with smooth ones • Some Principles • Solidity (squash and stretch) • Motion blur • Dissolves • Arrival and departure (from off-screen) • Exaggeration • Don’t just mimic relatity • Anticipation • Follow through • Reinforcement • Slow in and slow out • Arcs • Follow through
Cartoons vs. UIs • What is different? • UIs are interactive • Purpose: Fun vs. getting work done
Application using Animation: Gnutellavision • Animated Exploration of Graphs with Radial Layout, Ka-Ping Yee, Danyel Fisher, Rachna Dhamija, Marti Hearst, in IEEE Infovis Symposium, San Deigo, CA, October 2001. • Visualization of Peer-to-Peer Network • Hosts (with color for status and size for number of files) • Nodes with closer network distance from focus on inner rings • Queries shown; can trace queries
Animation in Gnutellavision Goal of animation is to help maintain context of nodes and general orientation of user during refocus • Transition Paths • Linear interpolation of polar coordinates • Node moves in arc not straight line • Moves along circle if not changing levels (like great circles on earth) • Spirals in or out to next ring
Animation (continued) • Transition constraints • Orientation of transition to minimize rotational travel • (Move former parent away from new focus in same orientation) • Avoid cross-over of edges • (to allow users to keep track of which is which) • Animation timing • Slow in Slow out timing (allows users to better track movement) • Small usability study • Participants preferred with animation for larger graphs
Evaluating Animation in UIs Thomas and Demczuk, Evaluation of Animation Effects to Improve Indirect Manipulation, First Australasian User Interface Conference, January 31 - February 03, 2000 • Examining animation effects to provide visual cues to highlight information about changes that come about indirectly. • Direct manipulation: when there is a straightforward mapping from user actions to visible changes • Some changes have no obvious mapping or require too much precision • Problem: • Pre and post-positions of graphical objects during an indirect manipulation alignment problem.
Thomas & Demczuk Study • Addressing two problems • Confusion caused by sudden visual change • Difficulty in predicting final result of a complex change • Figure 1: • Not obvious which objects in the top correspond to the ones below • Approach: • Cartooning animation techniques
Thomas & Demczuk Study • Three new visual effects • “Telltale”: objects are animated as if one of the corners is begin dragged by a mouse while the remainder of the object stays behind • Shorter than earlier work; only 10% of its distance • Color: used to cue the original position of the graphical object • Wiggle: cue the original position of the object
Thomas & Demczuk Study • Method: • Measure participants’ ability to remember the placement of the graphical objects • 4-8 objects moved after 5 seconds using one of: • Telltale • Color • Wiggle • No feedback • Participant then draws original positions • Hypotheses: • Animation & color cues will help P’s remember original positions compared to no feedback • P’s will prefer tasks with visual cues
Thomas & Demczuk Study Results:
Thomas & Demczuk Study • Results: • Animation cues helped task • P’s preferred animation cues • Negative response to the task with no cues
Analying Animation in UIs • C. Gonzales, Does Animation In User Interfaces Improve Decision Making? CHI ’96 • Improve the definition of animation • “A series of varying images presented dynamically according to user actions in ways tha thelp the user to perceive a continuous change over time and develop a more appropriate mental model of the task.” • Literature Review • There is little theoretical or empirical work about how to design, use, and evaluation animation for UIs
Analyzing Animation in UIs • C. Gonzales, Does Animation In User Interfaces Improve Decision Making? CHI ’96 • Improve the definition of animation • “A series of varying images presented dynamically according to user actions in ways tha thelp the user to perceive a continuous change over time and develop a more appropriate mental model of the task.” • Literature Review • There is little theoretical or empirical work about how to design, use, and evaluation animation for UIs
Animation in Instruction • Morrison & Tversky • Julie B. Morrison, Barbara Tversky The (in)effectiveness of animation in instruction CHI ’01 extended abstracts. • Tversky, Morrison, and Betrancourt, Animation: can it facilitate? IJHCS 57, 247-262, 2001. • Found animation did not aid (nor harm) instruction • Potential reasons • Hard to perceive (too fast/complex) • May be comprehended discretely • Lacking appropriate interactivity • They point out that studies that show animation benefits often have extra info over the diagrams • My question: if the diagrams have everything the animations do, maybe they are just slow animations?
Animation in Instruction • Stasko et al. • Did a series of studies on algorithm animation • Intially did not find effects either way • Changed the study • Kehoe, Colleen, Stasko, John and Taylor, Ashley, "Rethinking the Evaluation of Algorithm Animations as Learning Aids: An Observational Study", International Journal of Human-Computer Studies, Vol. 54, No. 2, February 2001, pp. 265-284 • From lab/exam-oriented to homework-oriented • Rich observations of how different tools were used together • Perhaps a more appropriate application of viz • For understanding of complicated steps in binomial heap algorithms • Positive results • Best when animation and explanation are simultaneous • Students need to be able to step through, control speed • Students were more accurate and enjoyed the work more with animation.