Download
1 / 44
440 likes | 590 Vues
Taking a Different Tack on Claims Control. The Stanford University Medical Center Decision Analysis Reserves Targeting (DART) Process. Taking a Different Tack on Claims Control. Speakers: Jeffrey Driver, Chief Risk Officer and Executive Vice President, Stanford University Medical Center

E N D
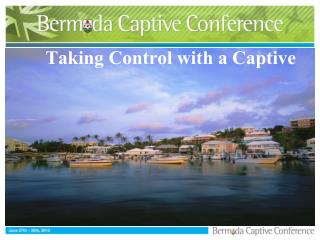
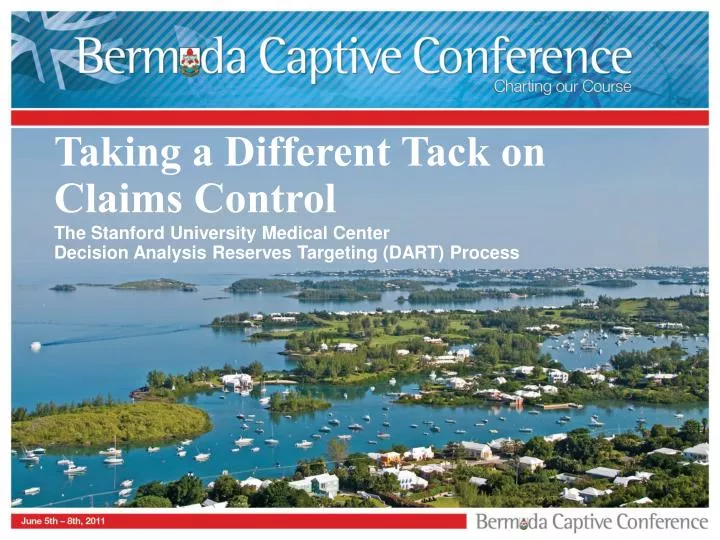
Taking a Different Tack on Claims Control The Stanford University Medical Center Decision Analysis Reserves Targeting (DART) Process
Taking a Different Tack on Claims Control Speakers: • Jeffrey Driver, Chief Risk Officer and Executive Vice President, Stanford University Medical Center • Ed Hall, Senior Director, Risk Management, Stanford University Medical Center • John Celona, ERM Practice Leader, Strategic Decisions Group Moderator: • Kathleen Bibbings, Executive Vice President, Aon Insurance Managers (Bermuda) Ltd.
Agenda • Intelligent captive management—Jeff Driver • Strategic claim risk management example • Quality control and process validation • How to get started • Q&A
DART Learning Objectives • Learn why and how to infuse value-driven and strategic ERM analytics into a captive insurance company processes • Preview and learn how Stanford’s Decision Analysis Reserve Targeting (DART) process is utilized to improve quantification of uncertainty in claims and litigated matters in a manner that provides for cascading fortification and robust guidance for: • pin-point case reserves • case management • accurate funding (premium) forecasting • Identify next steps to improving strategic captive risk management and claims processes.
An Introduction to SUMIT Shared Commercial Reinsurance Program Reinsurance Treaties SHC Cell SOM Cell Run-Off Cell LPCH Cell Bermuda Segregated Accounts Company “General Account” (Core) Minimum Statutory Capital (Section 56 Directive) Board of Directors (Sole Governing Body) Participation Agreement or Non-Voting Preference Shares Participation Agreement or Non-Voting Preference Shares Delaware LLC (taxable as P/S) 82% member with special allocation of SHC Cell loss history 18% member with special allocation of LPCH Cell loss history SHC LPCH SOM = Stanford University School of MedicineSHC = Stanford Hospital & ClinicsLPCH = Lucile Packard Children’s Hospital
Taking a Hard and Honest Look… WORST“The Worse Than Useless” BEST BETTER WORSE“The Merely Useless” BASELINE Risk Management Success/Failure Spectrum • Firm builds quantitative methods • Inputs are validated with proven statistical methods • Additional empirical measurements are used where optimal • Portfolio analysis of risk/return is used • Quantitative methods are used utilizing some proven components • Scope of risk management expands to include more forms of risk • Detailed “soft” or “scoring” methods are used or misapplied quantitative methods are used but not counted on by management • May be no worse that baseline except it wastes time and money • Management’s intuition drives risk assessment and mitigation strategies • Formal risk management is not attempted • Ineffective methods used with great confidence, even though they add error to evaluation • Much effort spent on seemingly sophisticated methods but no objective, measurable evidence that they improve on intuition • Methods cause erroneous decisions to be taken that would not have otherwise been made
Sources of Analytics Expertise Hubbard, Douglas: The Failure of Risk Management, 2009
A B C D E F 1 2 3 4 5 The War Quant Arsenal VALUE CREATION VALUE PROTECTION Value andRisk Map Probability Assessments Quantified Value Model Waterfall of Value Quantified Heat Maps Dashboards/ Monitoring Tornado Diagram Strategic Decision Insights Prob. Low • • Med uu uuuuu High uuuuu uu Priority NPV Green <$XXX Yellow Red >$XXX
Quantitative Tools Applied AcrossStanford Risk Consulting Spectrum
Agenda • Intelligent captive management • Strategic claim risk management example—John Celona • Quality control and process validation • How to get started • Q&A
Like many institutions, Stanford University Medical Center self-insures for medical care claims. • Claims arise from many sources: • Adverse patient outcomes • Mistakes by caregivers • Search for a “deep pocket” • May or may not progress to a lawsuit • Self-insured through the Stanford University Medical Indemnity Trust (SUMIT) • How much to reserve for a claim?
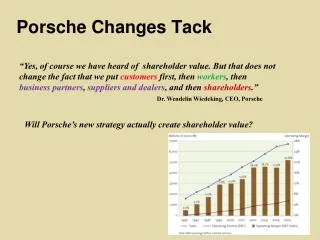
Our approach to making high-quality decisions under uncertainty is rooted in sound theory and based on extensive experience. Shareholder Value Movement Corporate Finance Rappaport Stern & Stewart Markowitz Sharpe System Engineering Marakon Fama Decision Theory Von Neumann & Morgenstern LaPlace Howard Bernoulli Raiffa Bayes Decision Analysis Behavioral Science Janis Kahneman & Tversky TQM March Simon Organizational Behavior Feigenbaum Real Options Gaming Edwards Cognitive Psychology Dynamics And Speed Juran Deming Quality Movement
Information & Beliefs ? Outcome ? Preferences Alternatives Decision The decision basis consists of alternatives, information, preferences, and logic. Logic A good decision is one that is logically consistent with what is known (alternatives, information, etc.) at the time the decision is made. A good outcome is what you hope will happen.
A key distinction is knowing when and how to applying statistical data analysis and subjective (Bayesian) probability.
Forecasting uncertainty or risk is big business. Can you do it with statistical analysis? Page
For this? Page
How about this? Page
What is Bayesian (subjective) probability? • Use of a number to represent a person’s (or persons’) experience and belief about the likelihood for an event to occur. • Avoids ambiguity: “likely” versus “very likely” • Lets you find the implications of that belief. • Depends on the state of knowledge at that time! • Simple rules: • List all the possible outcomes (mutually exclusive would be good). • Assign a probability to each. • All the probabilities must add up to 100%. The Reverend Thomas Bayes c. 1702 – 17 April 1761 Page
Why bother? Page
We next need to get our heads straight about decisions versus outcomes. • From “The Devil’s Dictionary,” by Ambrose Bierce • OUTCOME. n. A particular type of disappointment. By the kind of intelligence that sees in an exception a proof of the rule, the wisdom of an act is judged by the outcome, the result. This is immortal nonsense; the wisdom of an act is to be judged by the light that the doer had when he performed it. Page
A good decision? Page
How about this? Page
Applying value-driven ERM required following the cycle—with decision analysis methods. 1. Scan & Identify 2. Quantify & Prioritize ERM 5. Monitor, Audit & Learn 3. Design Solution 4. Plan & Manage
Step 1. Scan & Identify • Filed lawsuits • Claims • “Matters”—file opened • Need to identify uncertainties affecting each matter
Step 2. Quantify & Prioritize (I) Example Case • While visiting her physician, a patient requested a refill of a long-term medication. The physician intended to enter the order at the patient’s same dosage, but it was in fact entered and filled for a much higher dosage. • The patient began taking the medication and weeks later was taken to the emergency room complaining of symptoms which could result from an overdose of the medication. • The patient and spouse are suing for damages. • However, because of “curious” circumstances around the symptoms and allegations, the credibility of the patient is under question.
Implementation start: how to explain what we are doing. Action Deliberative Decision System Motivations; willpower; stress Intuitive Understanding Insight Affective Decision System “Experiments” 150,000 year-old Logical Co-processor (prefrontal cortex) 6 million-year-old Intuitive Supercomputer (older portions of brain) • Slower and more effort to invoke • Transparent, logical reasoning • Easy to manipulate • Does not lead to action unless trusted and persuasive • Fast, but goes astray with complexity and uncertainty • Subtle, complex reasoning process is difficult to trace • Governs emotions, trust, empathy & action • Specialized for understanding other people
Step 2. Quantify & Prioritize (II): Risk Assessment Jury Awards Lost Income Jury Finds Patient Credible Patient General Damages Spouse General Damages Lost Income Awarded Special Damages Verdict 50 .25 .50 25 Yes 50 150 .35 .25 .25 .25 10 .50 25 .50 75 Yes .65 .25 .25 No .25 10 50 60 .25 .50 40 Liable 50 .25 .25 30 .95 .50 Yes 25 15 25 .75 .15 .25 .25 .25 10 .50 10 .50 20 No .85 .25 .25 No 5 10 .05 Not Liable
Step 3. Design Solution (I) • Create business process for routine risk analysis of cases and matters • Identify threshold for analysis • Identify software for analysis • Identify outputs, documentation, and refresh intervals • Specify staff roles and responsibilities • Create decision rules for setting reserves based on analysis
Step 3. Design Solution (II) • Going forward, loss reserves for indemnity will be set at the mean of the overall exposure. • Some cases will resolve for more than the mean, and some for less. • If we’re doing a good job assessing exposure, the differences should cancel out over time. • Over time, this will provide the best matching of required payouts for cases against the premiums charged to fund loss reserves. Mean = $93,000
Step 4. Plan, Implement & Manage • Process documented and approved: the Decision Analysis Reserve Targeting process (DART) • Staff trained in application of methodology • Work begun on new cases and backlog of open cases • Reserves auditor and Stanford General Counsel briefed on and approve process • Tracking of case outcomes begun
Step 5. Monitor, Audit & Learn • Going forward, we will be tracking the difference between the actual cost to resolve a case and the mean (tracked as a percentage difference). Need to get better at estimating exposure Exposure systematically underestimated Frequency Frequency +200% 0% +200% 0% -200% -200% Difference between Actual and Mean The GOAL Exposure systematically overestimated Frequency Frequency +200% 0% +200% 0% -200% -200%
Agenda • Intelligent captive management • Strategic claim risk management example • Quality control and process validation—Ed Hall • How to get started • Q&A
Loss Development EXPECTED IMPACT ON Most Current Year with DART Applied
Agenda • Intelligent captive management • Strategic claim risk management example • Quality control and process validation • How to get started—Jeff Driver • Q&A
Levels of Strategic Risk Management Capability Level 1: Basic Quantification of Project-Level Risk Level 2: Quantification ofProject-Level Risk within anEnterprise Context Level 3: Basic Risk Managementwithin aFull Portfolio of BUs and Projects. Level 4: Organization-Wide Processes for Ensuring Comprehensive StrategicRisk Management • Increasing breadth across company • Increasing perspective on comprehensive risk • Increasing organizational commitment + + + • Stand-alone project-level risk assessment only • Addresses global risks only at the project level • Portfolio interactions not considered • Enterprise-wide risk assessment and alternatives • Accounts for intercompany effects • Common approach and uniform quality of analysis across company • Full evaluation of portfolio of risks/opportunities -- both project and enterprise • Fully developed risk management models that account for project level risks, enterprise-level risks, and intercomapny effectsusing value metrics • Dynamics, flexibility, risk rebalancing considered • Quantified Risk Tolerance • On-going regular process for value tracking and to update models and analysis as new opportunities are considered. • On-going business processes, training, & capability building • Continuous attention to balancing risk, managing claims, allocating risk, compensating for risk
Strategic Decision and Risk Management Stanford Certificate Program Empowering industry professionals to make high-quality decisions and embrace uncertainty and risk for competitive advantage.
Agenda • Intelligent captive management • Strategic claim risk management example • Quality control and process validation • How to get started • Q&A—panel