Download
1 / 10
100 likes | 108 Vues
This analysis examines the projected growth and spending trends in Medicare prescription drug costs from 2016 to 2025, highlighting the top 10 drugs and the percent of total drug costs covered by Medicare Part D rebates.

E N D
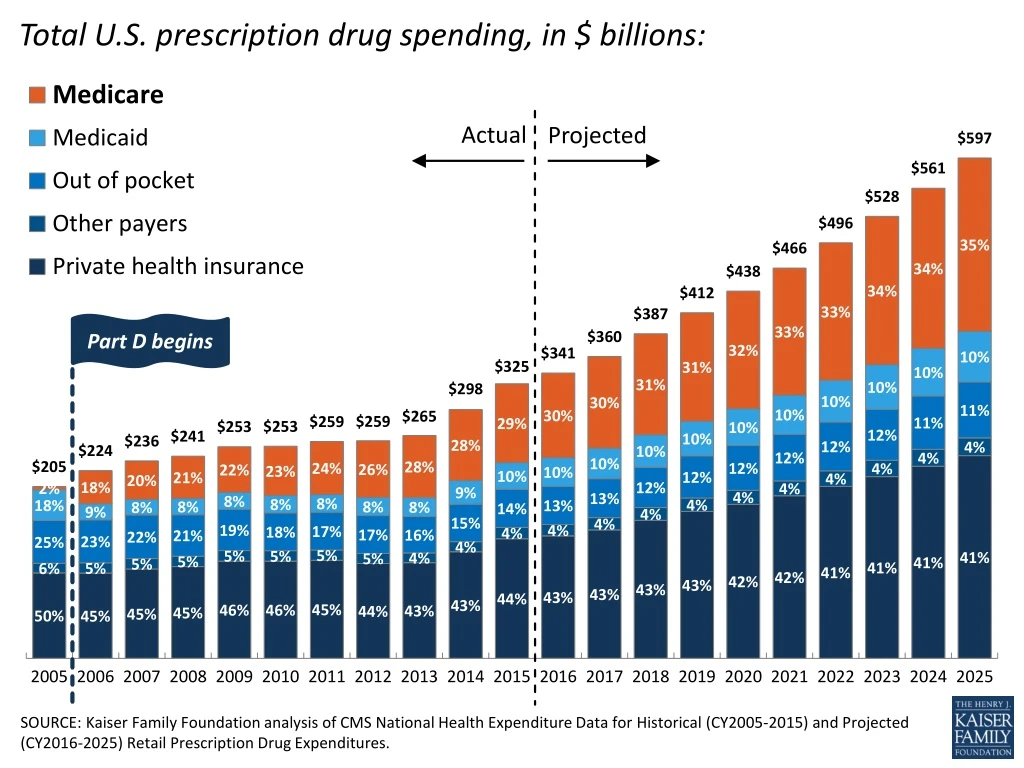
Total U.S. prescription drug spending, in $ billions: Actual Projected Part D begins SOURCE: Kaiser Family Foundation analysis of CMS National Health Expenditure Data for Historical (CY2005-2015) and Projected (CY2016-2025) Retail Prescription Drug Expenditures.
Total Medicare Spending in 2015 = $647.6 billion SOURCE: MedPAC, June 2017 Report to the Congress, Chapter 2, “Medicare Part B Drug Payment Policy Issues,” and 2017 Annual Report of the Boards of Trustees of the Federal Hospital Insurance and Federal Supplementary Medical Insurance Trust Funds, Tables III.D1 and V.B1.
Top 10 drugs: Total Spending on Medicare Part D Prescription Drugs in 2015: $137 billion SOURCE: Kaiser Family Foundation analysis of CMS Part D Drug Utilization and Cost Summary, Calendar Year 2015..
Medicare Part D rebates as a percent of total drug costs: SOURCE: 2017 Annual Report of the Boards of Trustees of the Federal Hospital Insurance and Federal Supplementary Medical Insurance Trust Funds, Table IV.B8.
Average annual growth in Medicare Part D per enrollee spending, actual and projected: SOURCE: Kaiser Family Foundation analysis of Medicare spending data from the 2017 Annual Report of the Boards of Trustees of the Federal Hospital Insurance and Federal Supplementary Medical Insurance Trust Funds, Table V.D1; 2017 Expanded and Supplementary Tables and Figures.
Annual Medicare Part D spending, in $ billions Actual Projected SOURCE: 2017 Annual Report of the Boards of Trustees of the Federal Hospital Insurance and Federal Supplementary Medical Insurance Trust Funds, Table IV.B10.
Average Out-of-Pocket Spending by Medicare Beneficiaries on Services in 2013: $3,257 NOTE: SNF is skilled nursing facility. Analysis excludes beneficiaries enrolled in Medicare Advantage plans and those in Part A or Part B only.SOURCE: Kaiser Family Foundation analysis of the Medicare Current Beneficiary Survey 2013 Cost & Use file.
Average out-of-pocket costs by Medicare Part D enrollees not receiving Low-Income Subsidies: NOTE: Analysis includes enrollees in stand-alone prescription drug plans and Medicare Advantage drug plans; excludes enrollees receiving Low-Income Subsidies. Out-of-pocket costs include Part D drug costs, but not Part D premiums or costs for Part B-covered drugs. SOURCE: Kaiser Family Foundation analysis of a five percent sample of 2015 Medicare prescription drug event claims from the CMS Chronic Conditions Data Warehouse.
Average out-of-pocket spending by Medicare Part D enrollees with out-of-pocket spending above the catastrophic coverage threshold: Phase-out of coverage gap begins NOTE: Analysis includes enrollees in stand-alone prescription drug plans and Medicare Advantage drug plans; excludes enrollees receiving Low-Income Subsidies. Out-of-pocket costs include Part D drug costs, but not Part D premiums or costs for Part B-covered drugs. SOURCE: Kaiser Family Foundation analysis of a five percent sample of 2007-2015 Medicare prescription drug event claims from the CMS Chronic Conditions Data Warehouse.
Percent who say they favor each of the following: 96% 92% 92% 84% 91% 91% 84% 88% 84% 78% 79% 79% 74% 74% 71% 66% 77% 75% 73% 68% 59% 59% 59% 53% 40% 60% 57% NOTE: Items asked of separate half samples. SOURCE: Kaiser Family Foundation Health Tracking Poll (conducted April 17-23, 2017).