Download
1 / 31
310 likes | 332 Vues
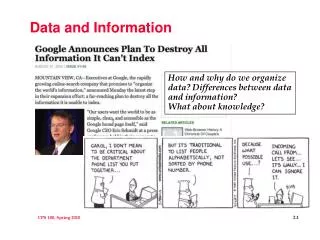
STAAR Information and Data. June 2012. Agenda. What we know about STAAR today Rigor and STAAR What Raw Scores can Tell Us How get the graphs. What Do We Know About STAAR?. What Do We Know About STAAR?. What we know about STAAR Today. TEA says

E N D
STAAR Information and Data June 2012
Agenda • What we know about STAAR today • Rigor and STAAR • What Raw Scores can Tell Us • How get the graphs (2012) by Region 7 Education Service Center. This document may be reproduced for educational use only.
What Do We Know About STAAR? (2012) by Region 7 Education Service Center. This document may be reproduced for educational use only.
What Do We Know About STAAR? (2012) by Region 7 Education Service Center. This document may be reproduced for educational use only.
What we know about STAAR Today TEA says “Fewer, Deeper, More Rigorous” What does that look like? TAKS STAAR (2012) by Region 7 Education Service Center. This document may be reproduced for educational use only.
TEKS Grade 5 (12) Probability and statistics. The student uses measures of central tendency and variability to describe a set of data. The student is expected to: (B) choose among mean, median, mode, or range to describe a set of data and justify the choice for a particular situation. (2012) by Region 7 Education Service Center. This document may be reproduced for educational use only.
TAKS Level 1 Laura looked at several different flower arrangements before purchasing one. The arrangements varied in price from $15.62 to 37.50. Which measure of data can be used to describe the variation in price of the different arrangements? F. Mean G. Mode H. Range J. Median 2009 69% (2012) by Region 7 Education Service Center. This document may be reproduced for educational use only.
Level 2 Laura looked at several different flower arrangements before purchasing one. The arrangements varied in price $16.00, $19.00, $22.00, $25.00 and 28.00. Which measure(s) of data would be affected the most if the price of the $22.00 arrangement was raised to $24? F. The range would be affected the most and raised by $2. G. The median and the mean would both change by $2 H. The median will increase $2 I. The mean will increase by $2. (2012) by Region 7 Education Service Center. This document may be reproduced for educational use only.
Level 3 Which statement below is true? • The mean, median and mode of a set of data can never be • all the same value. • The mean and median of a set of odd numbers of data are always the same value because they both are the middle of the data set. • The mean and the mode can never be the same value for any data sets. • Outliers always have more effect on the mean than the • median or mode. (2012) by Region 7 Education Service Center. This document may be reproduced for educational use only.
In the Classroom (2012) by Region 7 Education Service Center. This document may be reproduced for educational use only.
What we know about STAAR Today TEA says “Fewer, Deeper, More Rigorous” What does that look like? TAKS STAAR (2012) by Region 7 Education Service Center. This document may be reproduced for educational use only.
Organizing the Data 3rd Grade Math 46 problems Put in groups of 4 (2012) by Region 7 Education Service Center. This document may be reproduced for educational use only.
Organizing the Data (2012) by Region 7 Education Service Center. This document may be reproduced for educational use only.
Even Raw Scores Talk (2012) by Region 7 Education Service Center. This document may be reproduced for educational use only.
Even Raw Scores Talk (2012) by Region 7 Education Service Center. This document may be reproduced for educational use only.
70% 50% 60% Even Raw Scores Talk (2012) by Region 7 Education Service Center. This document may be reproduced for educational use only.
50% Even Raw Scores Talk (2012) by Region 7 Education Service Center. This document may be reproduced for educational use only.
Compare – What Does It Mean? (2012) by Region 7 Education Service Center. This document may be reproduced for educational use only.
6% 30% Algebra I #1 Implication 53% 0% Differentiation (2012) by Region 7 Education Service Center. This document may be reproduced for educational use only.
Directions for Data (2012) by Region 7 Education Service Center. This document may be reproduced for educational use only.
Directions for Data (2012) by Region 7 Education Service Center. This document may be reproduced for educational use only.
Directions for Data (2012) by Region 7 Education Service Center. This document may be reproduced for educational use only.
Directions for Data (2012) by Region 7 Education Service Center. This document may be reproduced for educational use only.
Directions for Data (2012) by Region 7 Education Service Center. This document may be reproduced for educational use only.
Directions for Data (2012) by Region 7 Education Service Center. This document may be reproduced for educational use only.
Directions for Data (2012) by Region 7 Education Service Center. This document may be reproduced for educational use only.
Directions for Data (2012) by Region 7 Education Service Center. This document may be reproduced for educational use only.
Directions for Data (2012) by Region 7 Education Service Center. This document may be reproduced for educational use only.
Directions for Data (2012) by Region 7 Education Service Center. This document may be reproduced for educational use only.
Directions for Data (2012) by Region 7 Education Service Center. This document may be reproduced for educational use only.
Questions???? Jane Silvey Associate Director Center for Curriculum Services jsilvey@esc7.net 903-988-6796 Directions for Data Lisa Mullins Lmullins@esc7.net Coordinator ELA/SS 903-988-6801 Liz Scott Coordinator Math/Science lscott@esc7.net 903-988- 6768 (2012) by Region 7 Education Service Center. This document may be reproduced for educational use only.