Download

1 / 55
560 likes | 676 Vues
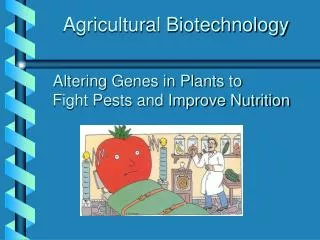
Agricultural biotechnology, productivity & the environment : an aggregate assessment. Geoffrey Barrows, Steve Sexton and David Zilberman UC Berkeley, Dept. of Agriculture and Resource Economics EAERE Conference Prague, 2012. Outline*. Biotechnology as damage control agent Yield effects

E N D
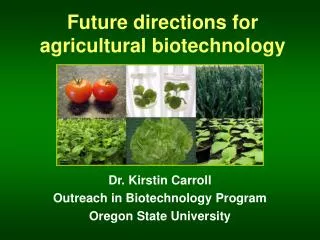
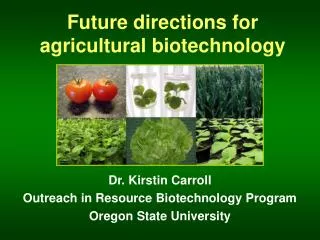
Agricultural biotechnology, productivity & the environment : an aggregate assessment Geoffrey Barrows, Steve Sexton and David Zilberman UC Berkeley, Dept. of Agriculture and Resource Economics EAERE Conference Prague, 2012
Outline* • Biotechnology as damage control agent • Yield effects • Supply effects • Implications
GE seeds reduce crop damage* • Effective output = potential output * damage abatement • Potential yield: f(z) • zare “directly-productive” inputs, e.g. fertilizer • Damage abatement: g(x, n) • x are “damage-control” inputs, e.g. insecticides • nis effective pest pressure • Effective output: y = g(x,n)f(z) • *based on • Lichtenberg Zilberman AJAE 1986 • Qaim Zilberman Science 2003
Impacts on GMO on yield • GMO will reduce pest damage especially when the pesticides were not effective or expensive • It may reduce yield if the trait was inserted in an inferior variety • It may increase yield by increasing the use of complementary input like fertilizers • If damage is reduced most fertilizers will be used • The impact of GM is grater than the “gene” effect- the complementarity effect may be substantial
Other effects of GM • Increased worker safety • Greater flexibility in farm management • Lower risk of yield variability-de facto insurance • Reduced effort • Impacts vary
Economic effects of GM • Introduction of GE varieties contribute to downward pressure of commodity prices; • The gains from adoption of GE varieties were distributed between farmers, US consumers, and consumers in the rest of the world;
Adoption of GM under Heterogeneity, pest damage Profit/acre, traditional technology $ Profit/acre, GMO Pest Damage Intensive margin extensive margin
Impact of Heterogeneity & Price • When pest damage vary by location • Location with low damage will not adopt • Location with high damage will adopt • Then there will be new entries • Adoption will increase in periods of high output prices • Adoption will increase when technology gets cheaper or more efficient
Intensive vs Extensive Margin • The supply effect of GMO technology includes intensive margin effects from yield increases and extensive margin effects from bringing new lands into production. • Can we decompose the supply effect into intensive and extensive margins? • Data: country level acreage panel data for 4 major GMO crops broken down by traditional vs GMO technology • Using these data, we design a methodology for quantifying acreage that switched from traditional technology (intensive margin) and acreage that entered production of a crop from some other employment (extensive margin)
Estimated yield effect of GE seed varies by trait, region (from Qaim ‘09)
What is the global impact of GE in adopting countries? • Spatial variation in adoption • Temporal variation in adoption • 8 crops (cotton, maize, rapeseed, soybean, wheat, sorghum, oats, and rice) • 100 “top” producing countries • 1990-2008 • By crop-country-year: total area (HA), total GE area, total production (MT)
Visual Diff-in-Diff: Yield percent deviation from mean (USA)
Visual Diff-in-Diff: Yield percent deviation from mean (Argentina)
Intensive vs Extensive Margin • The supply effect of GMO technology includes intensive margin effects from yield increases and extensive margin effects from bringing new lands into production. • Can we decompose the supply effect into intensive and extensive margins? • Data: country level acreage panel data for 4 major GMO crops broken down by traditional vs GMO technology • Using these data, we design a methodology for quantifying acreage that switched from traditional technology (intensive margin) and acreage that entered production of a crop from some other employment (extensive margin)
Data for the Sexton/Zilberman study • From 1996-2008, covering 8 crops (cotton, maize, rapeseed, • soybean, wheat, sorghum, oats and rice) and 100 "top" • producing countries • GM area and GM-trait area (in HA) by year, country, and crop • from ISAAA (courtesy of G. Brookes) • Yields, production (tons), harvest area (HA), prices by year, • Country and crop from FAOSTAT
Estimation • Scenario 1: All 2010 acreage planted to traditional tech • Scenario 2: Subtract extensive margin acreage • Scenario 3: All 2010 acreage planted to GMO tech
Econometric Results • GM yield effects are significant—both in statistical and economic senses • These estimates present an estimate of the “average treatment effect on the treated” • Selection controlled only at country level, not farmer level; this is an upper bound of the “population average treatment effect” • We estimated an “aggregate adoption” effect, not a “gene” effect
Econometric Results • Yield effect is greater in developing countries than in developed countries. • Theory: yield effect will be greater where: • Pest pressure is higher • Chemical use was low / ineffective
Implications for Land use • Gene revolution allows us to meet growing food demand without relying on farmland expansion alone • Without GE yield gains in ‘08, would have needed: • 8.6 million HA more land to produce maize crop • 11 million HA more land for soybean crop • An area of additional land equal to state of Kansas or total area planted to wheat in U.S. in 2008.
Implications for food security World Food Price Index in 2000 dollars (World Bank) GE lessens competition for land between food and (bio)fuel. Biofuels were blamed for as much as 45% increase in food prices during the last food crisis in 2008 (when prices rose 56%) Without biotech, the food crisis would have been worse
If there were broader adoption of GE • If top-10 producing countries had all adopted GE at the rate of the US . . . • maize production would have been 75 million tons higher just from yield gains • Biofuels recruited 86 million tons • Vegetable oils production would have been 37 million tons higher • Biofuels recruited 8.6 million tons
If there were broader adoption of GE • And if GE wheat were introduced in top-10 countries and yield gains mirrored those in soybean . . . • Production would have been 12 million tons higher • Biofuels recruited 26 million tons
HT seeds and double cropping • Tillage and persistence of herbicides complicate double cropping on many farms • GE shortens fallow periods (enabling more double cropping in two ways): • By allowing substitution toward less toxic and persistent herbicides like glyphosates; and • By allowing post-emergent herbicide applications to substitute for tilling operations.
HT seeds and double cropping Soybean production in Argentina and imports in China Double cropping wheat and late season soybean has created virtual land expansion of 10M acres in Argentina. Argentina has met fast-growing Chenese demand for soybean Also, wheat and sorghum in USA and Canada
Impact in cotton • Cotton is the only crop with adoption throughout the world • Did not suffer a a lrage price inflation as other crop • In US land was diverted to corn so contribute indirectly to reduced pressure on corn market
Implications • Beside reducing crop prices • Carbon Savings from Avoided Land-use Changes • GM saved on the order of 480-5,400 million MT of carbon annually • Boosting carbon sequestration on existing land 3.9 million tons of carbon in 2008 alone • Reducing input demand and fuel use
Implications • Beside reducing crop prices • Carbon Savings from Avoided Land-use Changes • GM saved on the order of 480-5,400 million MT of carbon annually • Boosting carbon sequestration on existing land 3.9 million tons of carbon in 2008 alone • Reducing input demand and fuel use
Implications • Beside reducing crop prices • Carbon Savings from Avoided Land-use Changes • GM saved on the order of 480-5,400 million MT of carbon annually • Boosting carbon sequestration on existing land 3.9 million tons of carbon in 2008 alone • Reducing input demand and fuel use