Download
1 / 63
700 likes | 1.04k Vues
Chapter 4 Inference About Process Quality. Motivation Estimation point estimation interval estimation Hypothesis Testing Definition Testing on means known and Unknown variance Testing on Variance . The need of “Statistical Inference”.

E N D
Chapter 4 Inference About Process Quality • Motivation • Estimation • point estimation • interval estimation • Hypothesis Testing • Definition • Testing on means • known and Unknown variance • Testing on Variance
The need of “Statistical Inference” • In statistical quality control, the probability distribution is used to model some quality characteristic (which is related to process parameters). • The parameters of a probability distribution are unknown. ?? • Estimation of Process Parameters • Point Estimation / Interval Estimation • The parameters of a process can be time varying, how do we identify a process change? • Hypothesis Testing
Observations in a sample are used to draw conclusions about the population
Random Samples • Random Sample: • Sampling from an infinite population or finite population with replacement: A sample is selected so that the observations are independently and identically distributed. • Sampling n samplesfrom a finite population of N items without replacement if each of the possible samples has an equal probability of being chosen Random Sample = Independently and Identically Distributed (i.i.d)
Terminology and Definition • Statistic: • Any function of the sample data that does not contain unknown parameters. • Estimate: a particular numerical value of an estimator, computed from sample data. (An estimate is a particular statistic) • Point estimate:a statistic that produces a single numerical value as the estimate of the unknown parameter • Interval estimate: a random interval (or called confidence interval) in which the true value of the parameter falls with some level of probability. • Sampling distribution: • The probability distribution of a statistic.
Point Estimation • Methods: [1] • Method of Moment (MOM) • Maximum Likelihood Estimation (MLE) [1] “Statistical Inference”, George Casella and Roger L. Berger, 2nd edition
/2 /2 x L U Interval Estimation • Estimate the interval between two statistics that include the true value of the parameter with some probability • Example: Pr{ L U}=1- (0 1) • The interval L U is called a 100(1- )% confidence interval (C.I.) for the unknown mean • Two side C.I. (L is lower confidence limit, U is upper confidence limit) • Single side C.I.: • lower 100(1- )% C. I.: L , Pr{ L }=1- • upper 100(1- )% C. I.: U, Pr{ U}=1- • Analysis procedures: • get the samples • compute the statistic • determine the statistic reference distribution • select confidence level • find the lower and/or upper confidence limits based on the reference distribution Real mean of the population
U L Q: how to determine the width?
where Interval Estimation If x is a random variable with unknown mean and known variance 2, what is the estimation interval for mean ? • Select a statistic • The approximate distribution of is regardless of the distribution of x due to the central limit theorem. • Given confidence level , then • 100(1-)% two-side confidence interval on is: • 100(1-)% upper confidence interval on is: • 100(1-)% lower confidence interval on is:
Example: The strength of a disposable plastic beverage container is being investigated. The strengths are normally distributed, with a known standard deviation of 15 psi. A sample of 20 plastic containers has a mean strength of 246 psi. Compute a 95% confidence interval for the process mean.
Example: A chemical process converts lead to gold. However, the production varies due to the powers of the alchemist. It is known that the process is normally distributed, with a standard deviation of 2.5 g. How many samples must be taken to be 90% certain that an estimate of the mean process is within 1.5 g of the true but unknown mean yield?
Interval Estimation of the Binomial Distribution Parameter with A Larger Sample Size
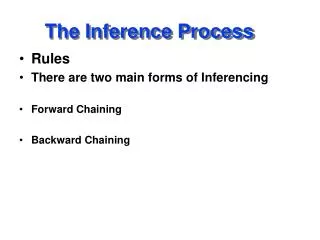
Hypothesis Testing • Statistical hypothesis: • a statement about the values of the parameters of a probability distribution • Hypothesis testing: • Making a hypothesis concerning what we believe to be true and then use sampled data to test it. • Two Hypotheses (Two Competing Propositions) • Null Hypothesis H0: will be rejected if the sample data do not support it. • Alternative Hypothesis H1: a hypothesis different from the null hypothesis • Conclusion • By Comparing the Test Statistic with Critical Value, determine whether reject or NOT reject the null hypothesis.
Hypothesis Testing Procedures 1) State the null and alternative hypothesis, and define the test statistic. 2) Specify the significance level . 3) Find the distribution of the test statistic and the rejection region of H0. 4) Collect data and calculate the test statistic. 5) Compare the test statistic with the rejection region. 6) Assess the risk.
Inference on the MEAN of a Normal Population – Variance Known Critical value Test Statistic: function of data and hypothetic value
Example:The response time of a distributed computer system is an important quality characteristic. The system manager wants to know whether the mean response time to a specific type of command exceeds 75 millisec. From past experience, he knows that the standard deviation of response time is 8 millisec. If the command is executed 25 times and the response time for each trial is recorded. The sample average response time is 79.25 millisec. • Formulate an appropriate hypothesis and test the hypothesis. • Find out the (lower/upper?) bound of the 95% C.I.
Inference on the MEAN of a Normal Population – Variance Unknown H1
Example: The mean time it takes a crew to restart an aluminum rolling mill after a failure is of interest. The crew was observed over 25 occasions, and the results were mean = 26.42 minutes and variance S2 =12.28 minutes. If repair time is normally distributed, • Find a 95% confidence interval on the true but unknown mean repair time. • Test the hypothesis that the true mean repair time is 30 minutes.
Example 6-1: The life of a battery used in a cardiac pacemaker is assumed to be normally distributed. A random sample of 10 batteries is subjected to an accelerated life test by running them continuously at an elevated temperature until failure, and the following lives are obtained. • Construct a 90% two-sided confidence interval on mean life in the accelerated test. • Test the hypothesis, with a=0.1 that the mean battery life is 26.5h.
The Use of P-Values in Hypothesis Testing 1. Traditional hypothesis testing: • Given to determine whether the null hypothesis was rejected • Disadvantage: • No information on how close to/far away from the rejection region in a probability sense • predefined may not reflect different decision maker’s risk assessments 2. P-Value approach • P-Value: the smallest level of significance that would lead to rejection of the null hypothesis • if the predefined >P= min, reject the null hypothesis Underlying idea: “if H0 is really true, is it possible for test statistic to be such big/small?”
Two-sided p_value
f(x) (Z0) 1-(Z0) x =0 Z0>0 Z0<0 Use of P-Value for the Normal Distribution H0: =0, standard normal statistic Z0~N(0,1) • P=2[1-(|Z0|)] with two-sided H1, i.e., H1: 0 • P=1-(Z0) for one-sided H1, H1: >0 • P=(Z0) for one-sided H1, H1: <0 A small p-value is evidence against the null hypothesis while a large p-value means little or no evidence against the null hypothesis If p-value is small, it is less likely that the test statistic is small. So, H0 is NOT true.
Inference on the MEAN of a Normal Population – Variance Known p_value H1
Example: The response time of a distributed computer system is an important quality characteristic. The system manager wants to know whether the mean response time to a specific type of command exceeds 75 millisec. From past experience, he knows that the standard deviation of response time is 8 millisec. If the command is executed 25 times and the response time for each trial is recorded. The sample average response time is 79.25 millisec. Formulate an appropriate hypothesis and test the hypothesis. • Calculate the p-value of the true mean response time is as low as 75 millisec.
Inference on the MEAN of a Normal Population – Variance Unknown p_value CDF H1
Example: The mean time it takes a crew to restart an aluminum rolling mill after a failure is of interest. The crew was observed over 25 occasions, and the results were mean = 26.42 minutes and variance S2 =12.28 minutes. If repair time is normally distributed, find a 95% confidence interval on the true but unknown mean repair time. • Test the H0: μ = 30 v.s. μ ≠ 30. • Calculate the p-value of the hypothesis that μ = 30.
Example: The life of a battery used in a cardiac pacemaker is assumed to be normally distributed. A random sample of 10 batteries is subjected to an accelerated life test by running them continuously at an elevated temperature until failure, and the following lives are obtained. Construct a 90% two-sided confidence interval on mean life in the accelerated test. Test the H0: μ = 26.5 v.s. μ ≠ 26.5. • Calculate the p-value of the hypothesis that μ = 26.5.
Confidence Interval v.s. Hypothesis Testing • If the value of the parameter specified by the null hypothesis is contained in the 100(1- )% interval, then the null hypothesis cannot be rejected at the level. • If the value specified by the null hypothesis is not in the interval, then the null hypothesis will be rejected at the level
Understanding the result of Hypothesis Test • When we reject the null hypothesis, it is a strong conclusion: there is a strong evidence that the null hypothesis is false. • When we fail to reject the null hypothesis, it is a weak conclusion: It does not mean that the null hypothesis is correct. It only means we do not have strong evidence to reject it.
Court System and Hypothesis Testing Hypothesis testing in science is a lot like the criminal court system in the United States. How do we decide guilt? • Assume innocence until “proven” guilty. • Evidence is presented at a trial. • Proof has to be “beyond a reasonable doubt.” A jury's possible decision: • guilty • not guilty Note that a jury cannot declare somebody ``innocent,'' just ``not guilty.'' This is an important point.
Confidence Interval Statistical Distribution Hypothesis Testing p_Value Interrelationships between statistical inferences
P=2[1-(|Z0|)] with two-sided H1, i.e., H1: 0 Interrelationships between statistical inferences
Inference on the Difference in Means of Two Populations – Variance Known Observations in TWO samples are all i.i.d. p_value H1
Inference on the Difference in Means of Two Populations – Variance Unknown i.i.d. ; Equal variance p_value H1
Inference on the Difference in Means of Two Populations – Variance Unknown H1
Text Book Page P696
Review • P-value: a probability value • With the same αvalue, C.I., Hypothesis testing and p-value give the same inferential conclusion. • Inferences on mean of two populations: what are the statistics used? What are the reference distributions? How to define the reject region?
Inference on the Variances of Two Normal Distributions The two d.f. are exchanged C.I.