Download
1 / 12
120 likes | 243 Vues
The Galactic Center: Molecular Line Mapping with Broadband Spectrometers. [ ]. Jürgen Ott (NRAO/Caltech). Christian Henkel (MPIfR), Michael Burton (UNSW), Axel Weiss (MPIfR), Lister Staveley-Smith (UWA), Alberto Bolatto (U Maryland), Paul Jones (UNSW). A. Weiss (MPIfR),

E N D
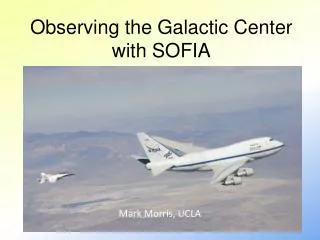
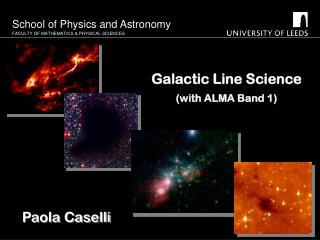
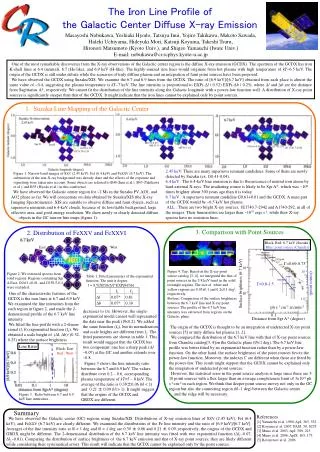
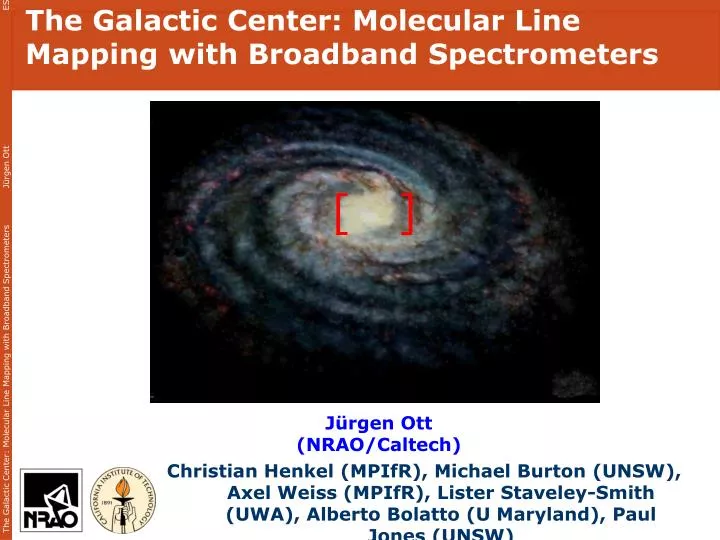
The Galactic Center: Molecular Line Mapping with Broadband Spectrometers [ ] Jürgen Ott (NRAO/Caltech) • Christian Henkel (MPIfR), Michael Burton (UNSW), Axel Weiss (MPIfR), Lister Staveley-Smith (UWA), Alberto Bolatto (U Maryland), Paul Jones (UNSW) • A. Weiss (MPIfR), • C. Henkel (MPIfR), • L. Staveley-Smith (ATNF)
Galactic Center Ammonia Survey • Galactic Center: rich in molecular gas and star formation • most nearby core of a galaxy • very different environments • extreme physical forces: shear, magnetic fields, tidal forces
Galactic Center Molecular Line Surveys • ATCA high resolution interferometric imaging of • ammonia in the Galactic Center (PI: J. Ott) • resolution: ~27” = 1 pc, (Dl, Db)=(1, 0.2) degree • 1cm Mopra 20-28 GHz spectral line survey (PI: J. Ott) • resolution: ~2.4’ = 6pc, (Dl, Db)=(3.5, 1.1) degree • 3mm Mopra 80-115 GHz line survey (PI: M. Burton) • resolution: ~40” = 1.6pc, (Dl, Db)=(1.1, 0.4) degree • CARMA HCN/N2H+ mapping • resolution: ~5” = 0.2pc, (Dl, Db)=(0.4, 0.15) degree
9/10 Ammonia in the Galactic Center Sgr A* Sgr B2 (Scuba 850 microns) 150 pc 30 pc Pierce-Price et al. (2001) • 0.2 degr2 840 pointings, 4min each • (total: 150x30pc) • NH3 (1,1) & (2,2) • 27” resolution = 1 pc
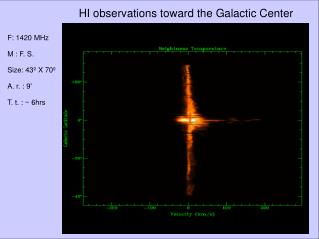
Temperature Structure of the GC Ammonia (1,1) distribution in the Galactic Center Region NH3 (1,1) peak flux map
Temperature Structure of the GC Ammonia (1,1) distribution in the Galactic Center Region Kinetic Temperature Map of the GC Blue: ~30 K, green: ~ 50 K, red: > 80K
Mass, Velocity, Density, Temperature density nH2: 104…107 cm-3 mass M: 103…105.5 Mo velocity Dv: 1…100km s-1 pressure P/k: 106…109 K cm-2
3mm Mopra survey ~170 lines detected in 88-114 GHz (3mm range) Jones et al. 2008
3mm Mopra Survey HCN CARMA 5” HC3N Resolution: ~40” (1.6pc) CH3CN Jones et al. 2008
1cm Mopra Survey NH3(1,1) Sgr B2 Sgr A* NH3(6,6) NH3(2,2) NH3(9,9) 850K above ground state! NH3(3,3) NH3(2,1) non-meta-stable lines
1cm Mopra Survey H2O CCS HDO HNCO HC3N H2C2N
Summary • A new generation of very broad-band spectrometers is coming online • (e.g., MOPS, Zspectrometer, CABB, WIDAR, ALMA correlator) • Huge amount of spectral line data is/will become available • Example: Galactic Center: maps of more than 200 lines • will be available over at 1-4 degree extent • New era in understanding complex chemistry and physics • Need for tools to model and understand the data