Download
1 / 17
180 likes | 406 Vues
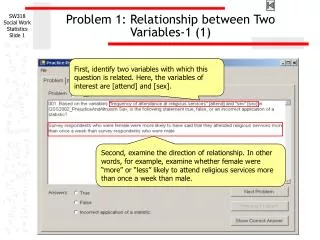
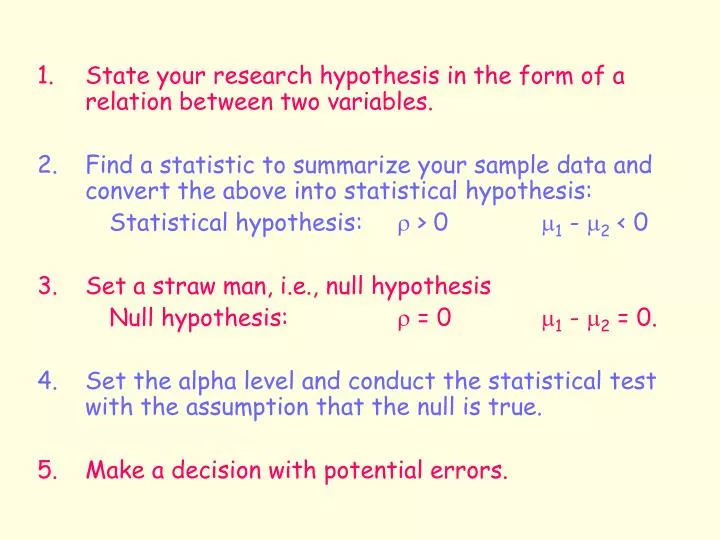
1. State your research hypothesis in the form of a relation between two variables. 2. Find a statistic to summarize your sample data and convert the above into statistical hypothesis: Statistical hypothesis: r > 0 m 1 - m 2 < 0 3. Set a straw man, i.e., null hypothesis

E N D
1. State your research hypothesis in the form of a relation between two variables. 2. Find a statistic to summarize your sample data and convert the above into statistical hypothesis: Statistical hypothesis: r > 0 m1 - m2 < 0 3. Set a straw man, i.e., null hypothesis Null hypothesis: r = 0 m1 - m2 = 0. 4. Set the alpha level and conduct the statistical test with the assumption that the null is true. 5. Make a decision with potential errors.
Sampling Distribution of a Statistic Imagined and theoretical
μ=72 μ=72 PopulationSampling Distribution
Sample size N = 36 μ=72 μ=72 μ=72
Sample Size N = 16 μ=72 μ=72
Sample Size N = 36 μ=72 μ=72
Central Limit Theorem The mean of the sampling distribution of means (any statistic) equals the population mean (any parameter). The standard deviation of the sampling distribution of means (any statistic) equals the population standard deviation divided by the square root of sample size. This is called the standard error of means. The sampling distribution of means is normal independent of the pattern of the population distribution, given a large enough sample size (e.g., n = 30)
An example: Hypothesis: Chinese children today are overweight. Choose a statistic: Mean weight Past records: m = 50 lb; s = 30 lb H1: m > 50 lb H0: m = 50 lb a<.01 n = 225 children ages 7 to 9;
Reject Null μ=50 2.32
Point estimate: Interval estimates: CI90 1.64 -1.64
An example: Hypothesis: Children’s weight differs from past. Choose a statistic: Mean weight Past records: m = 50 lb; s = 30 lb H1: m 50 lb H0: m = 50 lb a<.01; two tails, a<.01/2 or a<.005 at each tail n = 225 children ages 7 to 9;
-2.58 μ=50 2.58
Null Hypothesis Actually True Actually False NOT reject Decision Reject
H0: μ = 50 Reject Null .05 z = 1.96 μ= 50 H1: μ > 50 power β
H0: μ = 50 Reject Null .01 z = 1.96 μ= 50 H1: μ > 50 power β
Large N H0: μ = 50 Reject Null .05 μ= 50 z = 1.96 H1: μ > 50 power β
Small N H0: μ = 50 Reject Null .05 μ= 50 z = 1.96 H1: μ > 50 power β