Download
1 / 37
440 likes | 766 Vues
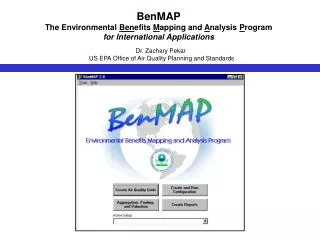
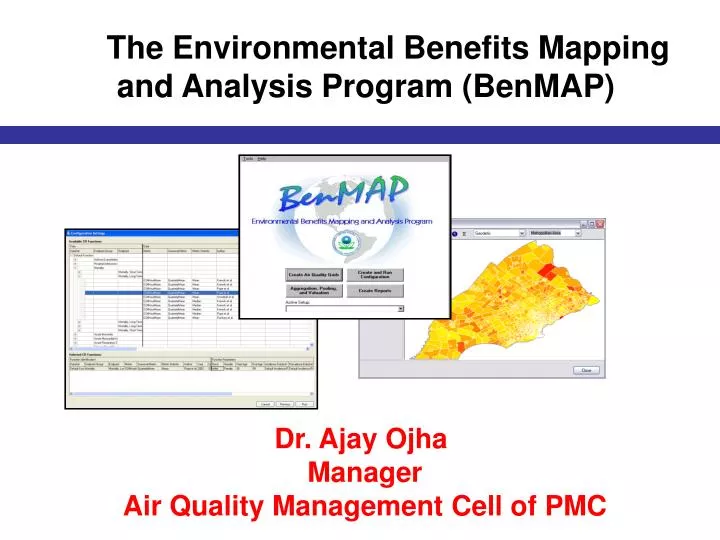
The Environmental Benefits Mapping and Analysis Program (BenMAP). Dr. Ajay Ojha Manager Air Quality Management Cell of PMC. Key Features. BenMAP is a PC-based GIS program developed by USEPA

E N D
The Environmental Benefits Mapping and Analysis Program (BenMAP) Dr. Ajay Ojha Manager Air Quality Management Cell of PMC
Key Features • BenMAP is a PC-based GIS program developed by USEPA • Estimates the Health Benefitsassociated with air quality changes by creating population-level exposure surfaces • Estimates Changes in Incidencesof a wide range of health outcomes associated with ambient air pollution • Places an Economic Valueon these reduced incidences • BenMAP produces both Point Estimates and Distributions of Incidence and Value Estimates
Steps in Analysis Air quality changes Air monitoring data Air modeling data Effect estimates (epidemiology) Population data Health surveillance data Valuation functions Baseline conditions (air quality WITHOUT regulation/policy scenario in place) Control conditions (air quality WITH regulation/policy scenario in place) Health effects incidence estimation Reduction in population-level exposure to air pollution Reduction in health effects incidence (deaths and disease cases) Valuation Monetary value (benefits) of health effects incidence reductions
STEP I in Analysis: Air Quality Grid Creation • Model direct – use model-generated air concentration coverage (no interpolation) • Monitor direct – interpolate air concentration surface based on monitor (empirical) data • Monitor and model relative – use model data to support interpolation of monitor data • Monitor rollback – incremental or “roll back to standard” reduction in monitor values followed by interpolation
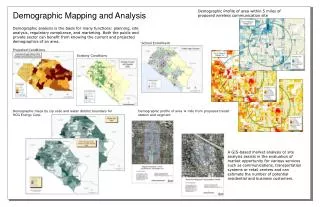
Air Quality Grid Creation – Monitor Direct Monitor direct:spread (interpolate) monitor data using different approaches VNA Population unit from Census Interpolation Closest Neighbor PM2.5 monitors
Loading of monitor:Monitoring data gathered at 20 locations from 1995 to 2004 Limitations in missing database for regular PM10 for few monitors 3 monitors having regular PM10 database utilized Fixed fraction of SPM assumed to be PM10 as average from the monitored data PM10 & SPM-Estimated PM10 Monitor in 2000) PM10 & SPM-Estimated PM10 Monitor 2004
Generation of Control Scenario • Percentage: reduce all values same percentage required for exceedance point to achieve standard • Incremental: reduce all values same increment required for exceedance point to achieve standard • Standard :- (1) associated with the Attainment Test, which determines whether monitor is in attainment, (2) used to bring out of attainment monitors into attainment. ug/m3 33% (percentage) all monitor values reduced set percentage (e.g., 25%) DAY 10ug/m3 (incremental) all monitor value rolled back a set increment (e.g., 10 ug/m3) 60 ug/m3 daily standard all monitors rolled back so they achieve specified standard (e.g., 60 ug/m3 24hr daily average)
Estimating Exposure: Creating air quality grids • User specified area via selected grid definition • Ward grid definition selected for Mumbai case study • Assuming estimations at centre of the ward is good exposure estimate – can be changed • Population data available for ward level and wards are most common geographical features • Monitors estimate only at one point and most wards do not have monitors • Use of Voronoi Neighbor Average (VNA) – identifies monitors near centre of each ward and uses inverse distance weighting • Limiting the distance of interpolation for more accuracy • Both Uniform gridand Ward grid were used for sensitivity analysis
Air Quality Grids – All monitors Rolled Back to 100 µg/m3 Without Action (Basline) With Action (Control)
Step II in Analysis Baseline conditions (air quality WITHOUT regulation/policy scenario in place) Control conditions (air quality WITH regulation/policy scenario in place) Change in air quality (difference between baseline and control air quality conditions) Reduction in population-level exposure to air pollution Reduction in health effects incidence (deaths and disease cases) Monetary value (benefits) of health effects incidence reductions
Exposure Estimates for Mumbai 2000 2004
Health effects incidence and benefits calculation (OVERVIEW) Project to future simulation year Multiple studies for the same endpoint – meta analysis Health impact function (lung cancer – PM2.5) Demographic (population count for tract) REDUCTION in incidence rate of lung cancer – related deaths in population Number of lung cancer deaths avoided in tract PM (annual mean PM2.5) Subtract tract-level annual mean PM2.5 concentrations Project to future simulation year Control air quality grid Baseline incidence rate for lung cancer-related mortality in study population Baseline air quality grid
Health Impacts and Studies Used in Analysis for Mumbai • Only 3 time series studies considered – several uncertainties may exists • Cohort studies Pope (2002) shown different results and may be used
Health Impact Function Baseline Mortality Rate • Studies conducted by Kumar et. Al (2002) • Gathered mortality statistics from the Bombay Municipal Corporation • Ward level population data was used gathered in 2001 through National Census • Three age groups: Under 18, Between 18 & 64, and Over 64 years of age.
Generation of Health Incidence (risk) Estimates (Based on figure developed by Abt Associates) Mortality reduction Air quality change Effect estimate Incidence rate = Population * * * Mortality reduction = 8 * 0.00402 * 0.01 * 3700 =1.5 (rounded to 2) deaths avoided
Contd… Hospital Admissions • No studies available in India • One carried by the Hyderabad Environment Protection Training & Research Institute (2005) • However, study based on US estimates – Estimation to be used with CAUTION Incidence Rate • No good estimates for hospital admissions • Environment Protection Training & Research Institute (2005) study • The study calculates incidence rate for Hyderabad – may have some uncertainty
Contd… • For Cough, Only one unpublished study by Kumar was available and used • For Lower & Upper Respiratory Symptoms (asthma, itchy eyes, cough, phlegm, and sinusitis) - study by Vichit-Vadakan (2001) for Bangkok, Thailand considered • Minor Restricted Activity Days - Ostro and Rothschild (1989) • Health data expected to introduce uncertainty • Preferred for the case study to provide point of comparison between different sets of results
Health Impact Estimation – Function Choice DRAG and DROP
Step III in Analysis Baseline conditions (air quality WITHOUT regulation/policy scenario in place) Control conditions (air quality WITH regulation/policy scenario in place) Change in air quality (difference between baseline and control air quality conditions) Reduction in population-level exposure to air pollution Reduction in health effects incidence (deaths and disease cases) Monetary value (benefits) of health effects incidence reductions
Generation of Monetized Benefits Estimates Unit (monetary) value Monetized benefit estimate Mortality reduction = * Benefits (rupees) = 2 avoided deaths * 5.5 million =11 million – Example data
Running Configurations Reusable file that stores the choices involved in estimating health impacts • Air quality grids, selected health impact function, population data, uncertainty characterization, etc • Once created – can be used many times to generate health impact estimates that are directly comparable • Eg. 5 km maximum interpolation and no interpolation • Also can be done across analyses
Aggregation • AGGREGATION: Convert from one spatial scale (grid) to another grid. • Summarize results at spatial scale of interest to policy makers • Based on area-weighted apportionment (where required) which is conducted within BenMAP • Can save run speed and reduce data volume for results datasets.
Pooling • POOLING: Combining estimates together (e.g., summing across age groups, or pooling results for the same endpoint derived using different studies) • Meta Analysis (inverse weighted pooling) – random/fixed effects pooling • User-specified (subjective) weights • Addition and subtraction Different Age Groups (ADDITION) Different Studies (same endpoints) AVERAGING – variance weighted
Preliminary Results of some scenarios used for understanding BenMAP tool
Applications • National-scale regulatory development (United States): • - Cost-benefits analysis (Regulatory Impact Analysis) for PM and Ozone regulations focusing on mobile sources and power plants • Regional/urban analysis (in support or local-scale policy analysis) • Estimate benefits for PM control options (diesel bus retrofit) • Include consideration for all diesel sources (on-road and off-road) • Revealed harbor (shipping) as significant source • International • Number of training/collaborative initiatives (Mexico, China, Taiwan, Philippines, S. Korea) • Week-long training session followed by policy-relevant case-study assessments • ONGOING initiatives
Potential Applications in India • Policy Research Analysis • Actions Plans in India for 17 cities • Evaluation of actions already taken and that of proposed action plans • Risk Assessment, Cost Effectiveness Analysis, Cost Benefit Analysis • Integration with the present efforts of Pune Air Quality Management work already in pipeline
BenMap Web Page Search Navigational Capacity Mumbai Air Quality Database Year 1987 2000 2005 Parameters SO2 SPM NOx Air Quality Agencies MCGB Mobile Data Industrial Location Dumping Site Traffic Junctions Parameters NH3, SO2, H2S, NO2, SPM, RSPM, CO, O3, Benzene Health Data Report Available Parameters SPM RSPM SO2 NO2 H2S NH3 Year 1987 2000 2005 Agencies NEERI Literature /Papers Study Summaries Additional Source Agencies KEM Municipal Hospital Respiratory Disease URBAIR PMRAP ASIAN Benchmark Study Health Report Publication Paper Title List, Author, Subject Area List of References of Different Studies Trans Thane Creek Area Industrial Data From – The project carried out by NEERI funded by MPCB
Monthly Averages of Polynuclear Aromatic Hydrocarbons in RSPM Fraction at Bombay Source : NEERI
Monthly Averages of Trace Metals Concentrations in RSPM at Bombay (24 Hr. Avg. in ug/m3) Source : NEERI
South and Central Bombay City Eastern & Western Suburbs Petrochemical Area Benzo () Pyrene in Mumbai Area (1978 -1986) Source : Municipal Corporation of Greater Mumbai
South and Central Bombay City Eastern & Western Suburbs Petrochemical Area SPM (g/m3)in Mumbai Area (1978 -1986) Source : Municipal Corporation of Greater Mumbai
BenMAP – Strengths and Limitations • STRENGTHS • Flexibility – can use BenMAP anywhere in the world, using own data and map files • Data management – users can easily manage their own data and share with others • Speed – quickly perform analyses, and generate maps & reports • Pooling – several methods for combining health impact & monetary value estimate • Transparency – easy to check assumptions made in analysis • LIMITATIONS • No air quality model. Air quality modeling not available in BenMAP. • Loading data. Identifying and loading data requires careful attention to detail. • Map files. The ability to load maps should be improved - takes lot of time.
Available at the URL http://www.epa.gov/ttnecas1/benmodels.html http://www.epa.gov/ttnecas1/benmap2download.html Thank You Sincere Acknowledgements Ted Mac Donald, USEPA Zachary Pekar, USEPA Donald Mc Cubbin, Abt Associates, USA Dr. Rakesh Kumar, NEERI, Mumbai, India Dr. Dilip Boralkar, MPCB, Mumbai, India