Download
1 / 39
390 likes | 497 Vues
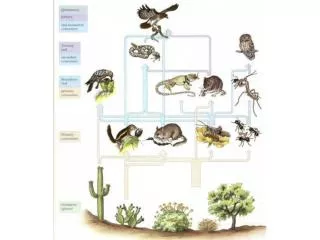
Acorns are a valuable food resource for many wildlife species. Influence survival and recruitment of many species. Acorns as a “keystone” resource: (Wolff 1996). * Affect populations of rodent mast consumers, which then… Affect seed predation and dispersal

E N D
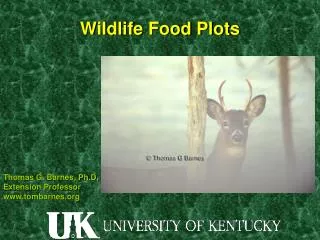
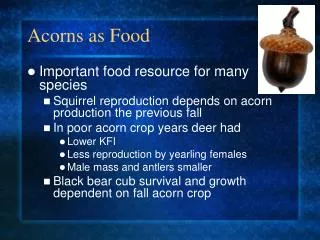
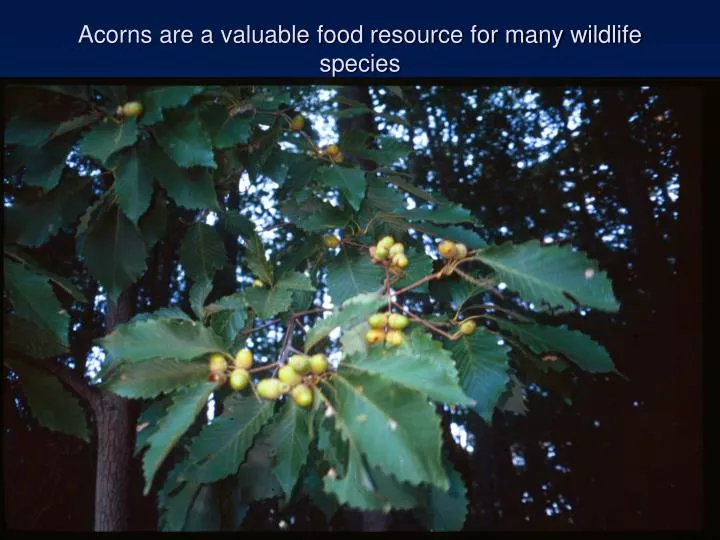
Acorns are a valuable food resource for many wildlife species
Acorns as a “keystone” resource: (Wolff 1996) * Affect populations of rodent mast consumers, which then… • Affect seed predation and dispersal • Affect populations of their predators; • Affect gypsy moth populations • Affect prevalence of Lyme disease * Affect deer populations, which then… • Affects regeneration and forest structure
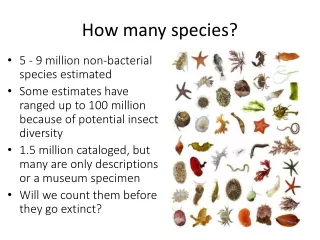
Acorn production varies • Among years • Among species • Among locations • Among individuals • … but tends to be synchronized…
Wide variation among individual oaks thought to be due to: • Age • Size • Stand density • Topographic position • Weather • GENETICS…
Why do Oaks Mast? • Predator satiation hypothesis – reduce predator populations in “bust” years, then satiate (+ surplus) in “boom” years. • Wind pollination hypothesis – synchronized flowering & pollination > fertilization and results in synchronized acorn production.
White Oak vs. Red Oak Groups • White oak subgenus (e.g., white and chestnut oaks) produce flowers (spring) and acorns (fall) during the same year. • Red oak subgenus (e.g., northern red, scarlet, black oaks) produce flowers in spring, but acorns develop during the fall of the next year.
Objectives • Describe how acorn production varies among years, species, & individuals • What identifies “good” acorn producers? • Potential new method for estimating within-year crop size
Study Background • Begun in 1991 (1993) by Don Beck, BCEF scientist • “Inherited” in 1995 when Don retired • Team effort – collections and trap maintenance done by District personnel • Large-scale study ended in 2000
Study Areas • Several areas within 3 southern Appalachian National Forests and 3 states: • Cherokee NF (Tennessee) • Pisgah NF (North Carolina) • Chattahoochee NF (north Georgia)
ACORN SAMPLING METHODS • 765 individuals of 5 species (northern red oak; scarlet oak; black oak; white oak; chestnut oak) • Wide range of dbh- and age-classes • Most trees dominant or codominant • Range of elevations (850-1180m), topographic conditions
Methods (con’t.) • Number of traps proportional to BA (2-14 per tree) • Crown areas computed as an octagon • Acorns collected by District personnel at approximately 2-week intervals • Acorns counted, classified, weighed green and dry in lab • Production estimates likely conservative, since traps don’t measure acorns that removed from tree crowns or traps
How Does Acorn Production Vary Among Species, Space, and Time?
Production varies within species Some synchrony in production among subgenera Mix of species often offsets crop failure Complete failure 1997 Variation among oak species
WO produced the most acorns, but NRO and WO produced the highest dry biomass.
Acorn production of each species varied among southern Appalachian National Forests
Species Other Averages Range (# / ft2 BA) __________________________________ Black Oak 115 – 588 Northern Red Oak 444 – 1525 Scarlet Oak 38 - 1034 Chestnut Oak 240- 259 White Oak 112 – 996 __________________________________ Geography, number of years sampled, which years sampled, sample size…
Does Bigger Mean Better? • In general, bigger trees produce more acorns…
That’s because bigger trees have bigger crowns, hence a greater area upon which to produce acorns.
But, do larger-diameter trees produce more acorns per unit BA than smaller-diameter trees?
Some species (BO, NRO, WO) produce fewer acorns per unit BA when they are <10 inches dbh.
What Characterizes “Good” Acorn Producers? * Fruiting Frequency* Density of Acorns
Ranked Trees as Poor, Moderate, or Good Producers (Healy et al. 1999) • Good producers produce, on average, > the 5-year mean for the species; • Moderate producers produce 60 – 100% of the species’ 5-year mean; • Poor producers produce < 60% of the species’ 5-year mean
Good producers have a greater density of acorns when they fruit.
Despite low representation, good producers outperform, especially during good crop years.
Hard to identify good producers, because good, moderate, and poor producers represented equally each year.
Acorn production is not synchronous within species. Good crop years are characterized by more trees producing acorns and by more acorns per producing tree.
This relationship may allow a new method for estimating crop size, simply by quantifying the % of trees (by species) producing each year.
Tested if there are more acorns per fruiting oak during years when more oaks are fruiting using NCWRC hard mast index data (1985-2005)
Then tested whether the proportion of trees bearing acorns could be used to predict Hard Mast Index (NCWRC data) • The % of trees bearing acorns is a good predictor of HMI • Developed predictive equations for all species, the red and white oak “groups”, and all oaks • Need to sample a lot of trees
The required sample size varies with the crop year, and with the desired confidence level • Confidence Level • _________________ • PBA 80% 90% 95% • ____________________________ • 10% 60 98 139 • 20% 106 174 246 • 30% 139 228 323 • 40% 158 260 369 • 50% 165 271 384 • 60% 158 260 369 • 70% 139 228 323 • 80% 106 174 246 • 90% 60 98 139 • _____________________________
Summary of Acorn Study Results • Acorn production varies among years & species. • Production not synchronous (3-29% vs 70-90%). • Good crop = more trees with acorns + more acorns/tree • Acorn density correlated with the % of fruiting trees. • Good producers produce more acorns more frequently. • Good producers constitute <50% of population, but produce the majority of the crop. • A similar % of good & poor producers produce in all years. • The % of trees bearing acorns predictor of crop size and hard mast index • Must sample a lot of trees to get good estimates
Management for Acorn Production: • Retain a mix of oak species • Oak size may be relatively unimportant • Retain good producers if possible