Download
1 / 104
1.04k likes | 1.21k Vues
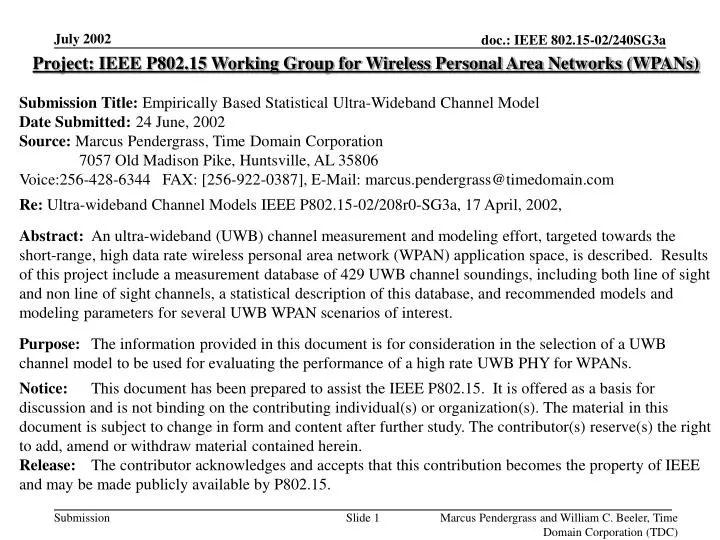
Project: IEEE P802.15 Working Group for Wireless Personal Area Networks (WPANs) Submission Title: Empirically Based Statistical Ultra-Wideband Channel Model Date Submitted: 24 June, 2002 Source: Marcus Pendergrass, Time Domain Corporation

E N D
Project: IEEE P802.15 Working Group for Wireless Personal Area Networks (WPANs) Submission Title: Empirically Based Statistical Ultra-Wideband Channel Model Date Submitted: 24 June, 2002 Source: Marcus Pendergrass, Time Domain Corporation 7057 Old Madison Pike, Huntsville, AL 35806 Voice:256-428-6344 FAX: [256-922-0387], E-Mail: marcus.pendergrass@timedomain.com Re: Ultra-wideband Channel Models IEEE P802.15-02/208r0-SG3a, 17 April, 2002, Abstract: An ultra-wideband (UWB) channel measurement and modeling effort, targeted towards the short-range, high data rate wireless personal area network (WPAN) application space, is described. Results of this project include a measurement database of 429 UWB channel soundings, including both line of sight and non line of sight channels, a statistical description of this database, and recommended models and modeling parameters for several UWB WPAN scenarios of interest. Purpose: The information provided in this document is for consideration in the selection of a UWB channel model to be used for evaluating the performance of a high rate UWB PHY for WPANs. Notice: This document has been prepared to assist the IEEE P802.15. It is offered as a basis for discussion and is not binding on the contributing individual(s) or organization(s). The material in this document is subject to change in form and content after further study. The contributor(s) reserve(s) the right to add, amend or withdraw material contained herein. Release: The contributor acknowledges and accepts that this contribution becomes the property of IEEE and may be made publicly available by P802.15. Marcus Pendergrass and William C. Beeler, Time Domain Corporation (TDC)
Empirically Based Statistical Ultra-Wideband (UWB) Channel Model Marcus Pendergrass and William C. Beeler 24 June 2002 with thanks to Laurie Foss, Joy Kelly, James Mann, Alan Petroff, Alex Petroff, Mitchell Williams, and Scott Yano for assistance and support. Marcus Pendergrass and William C. Beeler, Time Domain Corporation (TDC)
Executive Summary • Important to characterize the Wireless Personal area network (WPAN) environment. • 429 channel soundings taken in residential and office environments. • Statistical multipath models for 3 environments described: LOS 0-4 meters, NLOS 0-4 meters, NLOS 4 - 10 meters. • Channel response modeled as a sum of scaled and delayed versions template waveform. • Good fit to measurement data. Distortion <1dB. • Recommendations offered Marcus Pendergrass and William C. Beeler, Time Domain Corporation (TDC)
Outline • Introduction • Measurement Campaign • Data Analysis • Statistical Environmental Models • Analytical Models • Conclusions/Recommendations Marcus Pendergrass and William C. Beeler, Time Domain Corporation (TDC)
Introduction • Measurement Campaign • Data Analysis • Statistical Environmental Models • Analytical Models • Conclusions/Recommendations Marcus Pendergrass and William C. Beeler, Time Domain Corporation (TDC)
Introduction • Channel Impulse Response (CIR) modeling of radio-frequency channels necessary for system design, trades. • Multipath channel effects will be a key determinant of system performance, reliability. • Large literature on channel modeling available, including work on the UWB channel in particular. • Important to characterize the wireless personal area network (WPAN) environment in both line of sight (LOS) and non line of sight (NLOS) cases. • Models should be tuned to WPAN applications and environments. Marcus Pendergrass and William C. Beeler, Time Domain Corporation (TDC)
Approach • Measurement Campaign • Channel soundings taken in a variety of WPAN-type environments. • Data Analysis • Deconvolution of channel impulse response (CIR) from measurements. • Assessment of channel distortion. • Statistical analysis of UWB channel parameters as a function of environment type. • Fit existing models to data • IEEE 802.11 model. • The D-K model. • Assess goodness of fit • Recommend models, parameters Marcus Pendergrass and William C. Beeler, Time Domain Corporation (TDC)
Overview of Results • 429 channels soundings taken from 11 different home and office environments. • Data will be made available to SG3a. • Environmental signal distortion estimated. • Multipath channel parameters described statistically: • RMS delay • Distribution of multipath arrival times. • Average power decay profile. • Ability of existing models to capture the phenomenology of the data assessed. • Recommendations made for models and parameters. Marcus Pendergrass and William C. Beeler, Time Domain Corporation (TDC)
Introduction • Measurement Campaign • Data Analysis • Statistical Environmental Models • Analytical Models • Conclusions/Recommendations Marcus Pendergrass and William C. Beeler, Time Domain Corporation (TDC)
Purpose • Support statistical analysis WPAN propagation environments by obtaining a well-documented set of diverse measurements of the UWB channel. • Short range (0-4 meters), and medium range (4 - 10 meters) • LOS and NLOS channels • office and residential environments Marcus Pendergrass and William C. Beeler, Time Domain Corporation (TDC)
Measurement Plan • NLOS and LOS measurements for WPAN multipath channel characterization. • Metal stud and wooden stud environments. • Metal studs typical of office environments; wooden studs more typical of residential environments. • 11 different office and home locations • Detailed documentation for each channel sounding • X,Y,Z coordinates of transmit/receive antenna locations. • Channel categorized as LOS or NLOS Marcus Pendergrass and William C. Beeler, Time Domain Corporation (TDC)
Test Setup Details • Summary: • Approximately omni-directional transmit/receive antennas (roughly 3 dBi gain) • PCS and ISM band pass rejection filter • Effective noise figure: 4.8 dB at receive antenna terminals • Gain: 19.8 dB • Radiated power at approximately -10 dBm in the 3 to 5 GHz spectrum (close to FCC UWB limit) Marcus Pendergrass and William C. Beeler, Time Domain Corporation (TDC)
Test Setup Details • Data recorded: • 100 ns channel record. • 4096 data points per record. • Effective sampling time is 24.14 ps (20 GHz Nyquist frequency). • 350 averages per data point per channel record (for high SNR). • Triggered sampling for accurate determination of effective LOS arrival time. • Channel stimulus is UWB signal with 3 to 5 GHz 3 dB bandwidth, approximately 1.7 ns pulse duration. Marcus Pendergrass and William C. Beeler, Time Domain Corporation (TDC)
Channel Measurement Test Setup Marcus Pendergrass and William C. Beeler, Time Domain Corporation (TDC)
Measurement Issues • Received pulse distortion • Need accurate received pulse templates for deconvolution analysis. • Resolution: assessment of waveform distortion due to the angle of arrival of the incoming signal. • Determination of line of sight delay time in NLOS channels. • Accurate determination of multipath intensity profiles for NLOS channels requires knowing where the line of sight path would have arrived, had it not been obstructed. • Resolution: careful design and characterization of test setup and parameters (group delays, NF, antenna pattern, etc.), along with periodic excitation of the environment. Utilize known delays of test equipment, known transmit/receive locations, and periodic triggering to estimate what the direct path arrival time would have been for a NLOS channel. Marcus Pendergrass and William C. Beeler, Time Domain Corporation (TDC)
Measurement Issue:Received Pulse Distortion • Accurate received waveform template needed for effective deconvolution of channel impulse response. • Sources of waveform distortion: • environment (non-linear group delay, frequency-selective attenuation, etc.) • interference (intermittent and steady state) • antenna pattern • Environmental distortion to be estimated in data analysis. • Interference in minimized with appropriate filtering (PCS, ISM bands). • Distortion due to non-ideal antenna pattern was assessed empirically. • distortion as a function of elevation angle. Marcus Pendergrass and William C. Beeler, Time Domain Corporation (TDC)
0 TDC SG Typical Normalized Antenna Azimuth and Elevation Patterns (omni-directional antennas) Marcus Pendergrass and William C. Beeler, Time Domain Corporation (TDC)
Received Pulse Distortion Test Setup Marcus Pendergrass and William C. Beeler, Time Domain Corporation (TDC)
Pulse Distortion Test Results Normalized amplitudes • For angles of elevation between -70 degrees and +70 degrees, waveform distortion was found to be minimal. • Significant distortion near ±90 degrees elevation; however, signal is severely attenuated in this region. • Use of a single received pulse template was judged acceptable for deconvolution analysis. Marcus Pendergrass and William C. Beeler, Time Domain Corporation (TDC)
Measurement Issue:Determination of LOS Delay • In our test set-up, periodic excitation of the environment (non time-hopped) allowed for more accurate calculation of LOS delays. • With periodic excitation the channel ring-down from previous pulse can add to the recorded response data if the record length is shorter than the ring-down time of the channel. • Random excitation decorrelates the previous pulse’s ring-down from the recorded response through the DSO averaging process. • Effect is most pronounced in channels with high RMS delay spread. Marcus Pendergrass and William C. Beeler, Time Domain Corporation (TDC)
Periodic Channel Stimulus Example Marcus Pendergrass and William C. Beeler, Time Domain Corporation (TDC)
Random Channel Stimulus Example Marcus Pendergrass and William C. Beeler, Time Domain Corporation (TDC)
Minimal Effect on RMS Delay • Ability to accurately determine LOS delay was judged important enough to utilize periodic (non time-hopped) pulse trains. Marcus Pendergrass and William C. Beeler, Time Domain Corporation (TDC)
Channel Measurement Environments • 11 different office and home environments • Metal and wood stud constructions • Distances less than or equal to 10 meters. • 471 channel soundings taken in total. • Complete documentation of measurement locations and environments. Marcus Pendergrass and William C. Beeler, Time Domain Corporation (TDC)
Example Measurement Locations A Typical Office Environment Marcus Pendergrass and William C. Beeler, Time Domain Corporation (TDC)
Example Measurement Locations Conference Room Marcus Pendergrass and William C. Beeler, Time Domain Corporation (TDC)
Example Measurement Locations Residential Living Room Marcus Pendergrass and William C. Beeler, Time Domain Corporation (TDC)
Measurement Database • 471 channel soundings taken in total. • Database consists of a subset of 429 of these channels: • All measurements vertically polarized. • Includes received waveform scans and extracted channel impulse responses. • Includes calculated channel parameters, including RMS delay and path loss. • Also includes various measurement meta-data, including • locations of transmitter and receiver • channel categorized as LOS or NLOS. • calculated line of sight delay time • environment type (wood stud, metal stud) • polarization • number of intervening walls between transmitter and receiver. Marcus Pendergrass and William C. Beeler, Time Domain Corporation (TDC)
Introduction • Measurement Campaign • Data Analysis • Statistical Environmental Models • Analytical Models • Conclusions/Recommendations Marcus Pendergrass and William C. Beeler, Time Domain Corporation (TDC)
Analysis Goals • Extract a description of the channel that is independent of the channel stimulus. • Estimate “distortion” caused by the propagation environments. • Produce a statistical description of channel parameters as a function of environment type. Marcus Pendergrass and William C. Beeler, Time Domain Corporation (TDC)
Major Analysis Assumptions • Channel modeled as a linear time-invariant (LTI) filter. • assume that there are negligible changes to the channel on the time scale of a communications packet. • Impulse response for the channel is assumed to be of the form • channel’s effect on signal is modeled as a series of amplitude scalings ak and time delays tk. (1) Marcus Pendergrass and William C. Beeler, Time Domain Corporation (TDC)
CLEAN Algorithmused to deconvolve CIR from channel record • CLEAN is a variation of a serial correlation algorithm • Uses a template received waveform to sift through an arbitrary received waveform • Cross-correlation with template suppresses non-coherent signals and noise • Result is ak’s and tk’s of CIR independent of measurement system Marcus Pendergrass and William C. Beeler, Time Domain Corporation (TDC)
CLEAN AlgorithmCompared to Frequency Domain De-Convolution Marcus Pendergrass and William C. Beeler, Time Domain Corporation (TDC)
Original scan Error vector s s-r r CLEAN approximation to original scan (reconstructed scan) Linear space of all possible reconstructed scans CLEAN Algorithmgeometric interpretation Energy Capture Ratio: Relative Error: Least Squares Condition: (2) Marcus Pendergrass and William C. Beeler, Time Domain Corporation (TDC)
CLEAN Algorithmestimation of signal distortion • CLEAN returns the CIR in precisely the desired form (1). • Convolution of CIR with pulse template p(t) produces the “reconstructed” channel record r(t): • When the least squares condition (2) holds, the residual difference between the CLEAN reconstruction and original channel record is a measure of the distortion introduced by the channel (i.e. the amount of signal energy that is not of the form (1)). Marcus Pendergrass and William C. Beeler, Time Domain Corporation (TDC)
CLEAN Residual Estimates of Signal Distortion • Least squares condition met at 85% energy capture ratio, on average. • Estimated signal distortion: • NLOS, 0 to 4 meters, metal stud case: 15.5% (0.7 dB) • LOS, 0 to 4 meters, metal stud case: 16.6% (0.7 dB) • NLOS, 4 to 10 meters, metal stud case: 17.0% (0.8 dB) Marcus Pendergrass and William C. Beeler, Time Domain Corporation (TDC)
Introduction • Measurement Campaign • Data Analysis • Statistical Environmental Models • Analytical Models • Conclusions/Recommendations Marcus Pendergrass and William C. Beeler, Time Domain Corporation (TDC)
Data Used for the Analysis • 429 of the 471 channel records • all vertically polarized measurements. • duplicate measurements removed. Marcus Pendergrass and William C. Beeler, Time Domain Corporation (TDC)
General Remarks on the Data • Data collection SNRs varied from about 40 dB for 1-meter boresight scans to about 15 dB for some 10-meter NLOS scans. • LOS and NLOS channels exhibit wide variations in path loss and RMS delay spread. Some NLOS channels have lower delay spreads than some LOS channels. • The variations can be explained by grazing angles and destructive interference for LOS channels , and low attenuation through materials for NLOS channels. Marcus Pendergrass and William C. Beeler, Time Domain Corporation (TDC)
0.06 0.04 0.02 0 Amplitude -0.02 -0.04 -0.06 5 6 7 8 9 10 11 12 13 14 15 16 17 18 19 20 Time (ns) Scan #1: LOS 1m distance, Antenna Boresight1/r2 Path Loss Marcus Pendergrass and William C. Beeler, Time Domain Corporation (TDC)
-3 x 10 5 4 3 2 1 Amplitude 0 -1 -2 -3 -4 -5 0 5 10 15 20 25 30 35 40 Time (ns) Scan #57: LOS 3.1m distance, office environment, approximately 1/r5.28 Path Loss Check this one! Marcus Pendergrass and William C. Beeler, Time Domain Corporation (TDC)
-3 x 10 3 2 1 Amplitude 0 -1 -2 0 5 10 15 20 25 30 35 Time (ns) Scan #6: NLOS 1.3m distance, office environment, approximately 1/r26.5 path loss Marcus Pendergrass and William C. Beeler, Time Domain Corporation (TDC)
Scan #15: NLOS2.7m distance, office environmentapproximately 1/r2.07 Path Loss 0.02 0.015 0.01 0.005 Amplitude 0 -0.005 -0.01 -0.015 -0.02 0 2 4 6 8 10 12 14 16 18 20 Time (ns) Marcus Pendergrass and William C. Beeler, Time Domain Corporation (TDC)
Descriptive Statistics of the Data • CIRs and channel parameters extracted for all 429 records. • Statistical analysis and model fitting done only for metal stud measurements. • 369 metal stud measurements. • 60 wood stud measurements not enough for statistical breakdown. • Three scenarios considered: • I. NLOS, 0 to 4 meters, metal stud. • II. LOS, 0 to 4 meters, metal stud. • III. NLOS, 4 to 10 meters, metal stud. • Not enough LOS, 4 to 10 meter channels for analysis. Marcus Pendergrass and William C. Beeler, Time Domain Corporation (TDC)
Explanation of Channel Statistics • Channels characterized in terms of the following statistical parameters • RMS delay as a function of distance. • Mean excess delay as a function of distance. • Number of multipath components per channel. • Occupancy probabilities as a function of excess delay. • Mean log relative magnitudes as a function of excess delay. Marcus Pendergrass and William C. Beeler, Time Domain Corporation (TDC)
Channel Statistics multipath component amax kth relative magnitude: a1 amplitudes a0 ak tk t0 t1 time delays LOS delay kth excess delay: tk – t0 • Mean excess delay is a weighted average of the excess delays in the CIR. • CIR amplitudes are the weights • RMS delay is the standard deviation of the excess delays. • again using the CIR amplitudes as the weights. Marcus Pendergrass and William C. Beeler, Time Domain Corporation (TDC)
Mean relative magnitude over a collection of CIRs relative magnitude excess delay Probability that there is a multipath component at a given excess delay offset probability of occupancy excess delay Channel Statistics Marcus Pendergrass and William C. Beeler, Time Domain Corporation (TDC)
Dependence of Channel Statistics on CLEAN Algorithm Stopping Condition • Channel statistics computed from channel impulse response as calculated by CLEAN algorithm. • Dependence of channel statistics on stopping criteria assessed. • The following energy capture stopping criteria were evaluated: 80%, 85%, 90%, 95% Marcus Pendergrass and William C. Beeler, Time Domain Corporation (TDC)
80% Energy Capture (notional) amplitudes time Marcus Pendergrass and William C. Beeler, Time Domain Corporation (TDC)
85% Energy Capture (notional) amplitudes time Marcus Pendergrass and William C. Beeler, Time Domain Corporation (TDC)