Download

1 / 77
770 likes | 864 Vues
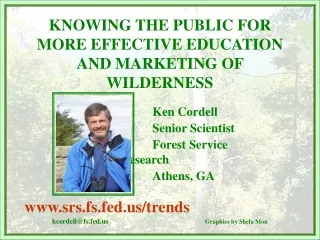
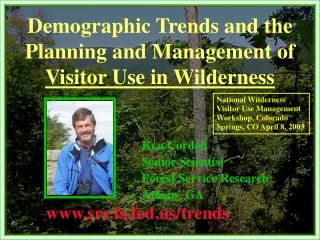
KNOWING THE PUBLIC FOR MORE EFFECTIVE EDUCATION AND MARKETING OF WILDERNESS Ken Cordell Senior Scientist Forest Service Research Athens, GA www.srs.fs.fed.us/trends kcordell@fs.fed.us Graphics by Shela Mou. Counties with Wilderness Acreage.

E N D
KNOWING THE PUBLIC FOR MORE EFFECTIVE EDUCATION AND MARKETING OF WILDERNESS Ken Cordell Senior Scientist Forest Service Research Athens, GA www.srs.fs.fed.us/trends kcordell@fs.fed.us Graphics by Shela Mou
Basic Environmental Values Led to Creation of the NWPS • The United States has designated 629(ish) areas totalling 105+ million acres. • On Federal lands, an additional 20 million acres are recommended for designation; between 35 and 45 million other roadless acres have been identified. • The Congress is not likely to add substantially to the NWPS, but the former Administration moved to protect and restore roadless conditions. On NFs alone almost 60 million. • Alpine, forest, desert, and water systems are better represented than grassland and subtropical ecosystems. • Recreational use, nearby development, pollutants, and political winds raise uncertainties about the future of the NWPS.
The Changing American Society • About 1 million new immigrants per year • More people: 1990 248 mm 2000 275 mm 2020 325 mm 2050 404 mm 2075 481 mm 2100 571 mm • Getting older: Median age 3538 (by 2020) • Changing ethnicities by 2050: Anglo Americans 76%50% African Americans 12% 15% Hispanic Americans 9% 21% Asian Americans 4% 11%
A BASIC QUESTION:IS WILDERNESS STILL APPROPRIATE AND WANTED BY TODAY’SU. S. SOCIETY?
SOCIAL CHANGE IS CONTINUOUS, POPULATION SURVEYING SHOULD BE ALSO
NSRE 2000 • A sample of over 50,000 households, from the Keys to ANWR • Includes individuals 16 years or older • Ties back to the first National Recreation Survey, Outdoor Recreation Resources Review Commission in 1960 • Is the Nation’s on-going recreation survey, the 8th • Interagency sponsorship—USFS, NOAA, ERS, EPA, NPS, BLM. • Others involved, National Scenic Byways Program, Heritage, Wilderness, Bicycle Safety, The Heinz Center • State of the Art delivery—Internet, books and reports
Core of agency and university scientists in charge of design and analysis Advisory group of nationally renown scientists Follows all protocols of the National Association of Public Opinion Research Exhaustive pretesting Data collected using a CATI System with University of Tenn. Diagnostics and corrections for response and non-response bias Data weighted to Bureau of Census standards Analysis using SAS and SPSS Refereed publishing THE SCIENCE OF NSRE
MODULES OF QUESTIONS • Participation in Recreational Activities • Recreation Participation in Coastal States • Frequency of Participation in Days • Favorite Activities and Constraints • Risk Activity Participation • Nature-based Trip Taking • Disabilities and Opinions about Management • Environmental Attitudes and Values • Values and Objectives for Management of Public Lands • Wilderness Values, Knowledge, Visitation, and Preferences for Management • Ownership of Private Land • Lifestyles and Demographics
LIFESTYLES--NEW • Hobbies or other interests • Do chores or garden at home • Involved with family • Into sports • Community or civic activities • Vacationing and travel • Self study and cultural events • Exercise • Keep up with new technologies, internet, etc. • Socializing and making friends • Eating out
DETAILED HOUSEHOLD AND INDIVIDUAL DATA*******(Uses all Bureau of Census Protocols)Number of household members by age and sexCitizenship, where born and country of originRace and ethnicityOccupation and employment statusCity, rural/urban, ZIP CodeChildhood originIncome and educationDisabilities
Activities Rising Fastest By Percentage (1982 to 2000) (16 or older) % GrowthNo. in 2000 Bird watching 235.9 71.2 Hiking 195.9 73.1 Backpacking 165.9 23.4 Snow-mobiling 107.5 66.9 Walking 91.2 179.0 Off-road driving 89.2 27.9 Primitive camping 81.9 32.2 Developed camping 76.0 52.8 Downhill skiing 66.9 17.7 Swimming/river, lake or ocean 64.4 78.1
Activities Adding the Most Participants 16 or older, 1982-2000 Millions GrowthNo. in 2000 Walking 85.4 179.0 Bird watching 50.0 71.2 Hiking 48.4 73.1 Swimming/river, lake, or ocean 36.4 92.9 Sightseeing 32.7 114.0 Picnicking 31.8 116.6 Bicycling 27.4 83.9 Developed camping 22.8 52.8 Motor boating 17.8 51.4 Off-road driving 17.3 36.7 Backpacking 14.6 23.4
Year 2000 Wilderness Area Visits on National Forests • Region Visits (1000’s) • 1 400 • 1,630 • 2,280 • 1,640 • 1,040 • 2,780 • 670 • 1,220 • 1,450 • TOTAL 13,110 Source: National Recreation Use Monitoring Study, 1/24/01
VariedLifestyles VariedLifestyles
VariedLifestyles VariedLifestyles
Voting on the Most Important Issue First Second Choice Choice Reducing Crime 29 23 Reforming Health Care 22 22 Saving Social Security 21 21 Protecting the Environment 16 23 Reducing the Public Debt 9 10 Don’t Know 3 1
“They (American’s surveyed) rank the environment third on their list of critical public issues requiring government support, just behind crime and education. 60% feel the government spends too little on the environment”.(National Opinion Research Center, Chicago, Ill.)
Humans Were Meant to Rule Over Nature 14% Strongly Agree 15% Somewhat Agree 29% 19% Somewhat Disagree 42% Strongly Disagree 61% (6% Neutral)
Spending on the Environment Too Much 7% Too Little 49% About Right 28% (Don’t Know) (15%)
Percentage of Americans Reporting Regulation of Natural Resources is “Just the Right Amount” or has “Not Gone Far Enough.” Source: Dujack, 1997.
Developing trail systems for motorized uses (29%) Expanding access for motorized vehicles (20%) Developing paved roads for cars (19%) Developing trail systems for non-motorized rec. (57%) Conserving/protecting sources of water (91%) Designating more wilderness areas (58%) Preserving resources through policies (75%) Preserving wilderness experience (74%) Protecting ecosystems/ habitats (86%) Expanding commercial recreation (28%) Informing public on potential environmental impacts (81%) Increasing acres in public land (53%) Objectives for Managing Public Lands (Percent saying important to very important) Providing resources to help local communities (51%) Source: NSRE/Shields VOBA Module
Public Land Management Objectives MOST Desired by the Public • Conserve and protect natural sources of water (91.4%) • Better information for users, such as respect for wildlife and trail etiquette (87.2%) • Protect natural ecosystems and wildlife habitats (86.0%) • More use of volunteers for resource protection and improvement (85.6%) • Better information for users about use impacts (81.1%) • Consistent policy for guiding resource uses and management (76.0%)
Public Land Management Objectives LEAST Desired by the Public • Develop more trails for motorized uses (28.9%) • Expand commercial recreation uses (28.2%) • Make special use permits easier to get (27.3%) • Trade public lands for private lands to consolidate public holdings (22.1%) • Expand access to motorized vehicles (19.8%) • Develop more paved roads (19.2%)
COMPARING IMPORTANCE OF PUBLIC LAND OBJECTIVES BETWEEN ETHNIC GROUPS Conserving/ Protecting sources of water Designating more wilderness areas Trail systems for non-motorized recreation Expanding access for motorized vehicles
Some Selected Values Concerning Public Lands Source: NSRE/Shields VOBA Module
Public Views on Wilderness • Nationally about 1/2 of American’s 16+ report knowing about the NWPS • Only 4.4% feel we have put too many acres into the NWPS: • - Not enough, 52.6% • - About right, 26.9% • - Too much, 4.4% • - Not sure, 15.4%
What Americans Value About Wilderness Extremely Important Slightly or Not Important Wilderness Value Percentage Saying It Is Protecting air quality 58.4 1.5 Protecting water quality 55.9 1.5 Protecting wildlife habitat 52.7 3.1 Protecting endangered species 49.8 5.0 Legacy for future generations 49.1 3.1 Preserving unique ecosystems and genetics 44.3 5.1 Future option to visit 37.5 7.1 Just knowing it is preserved 36.9 6.4 Providing scenic beauty 35.4 5.5 Providing recreation opportunities 27.8 7.2 Providing spiritual inspiration 25.9 16.7 Undisturbed area for scientific study 23.9 11.6 Providing income for tourism industry 9.7 33.5
TOP 5 VALUES • Protecting air quality • Protecting water quality • Protecting wildlife habitat • Protecting T&E species • Legacy for future generations (By Majority Vote)
Lowest 4 Values • Providing recreation opportunities • Providing spiritual inspiration • Using areas for scientific study • Stimulate income for tourism industry • (All Ballots Counted)
Overflights Banned 17% Limited 70% Not Banned or Limited 11% Don’t Know 2% Snowmobiles Banned 34% Limited 55% Not Banned or Limited 9% Don’t Know 2% Source: Haas, 1998.
Limit Visitors If Too Crowded 89% Limit Visitors If Resources Being Harmed 95% Source: Haas, 1998.
Should designate more Wilderness within Federal lands Important/ Very Important Urban 62% Suburban 56% Rural 47%
Should designate more Wilderness within Federal lands Important/ Very Important White 59% Black 49% Hispanic 56% Asian 75%
Should designate more Wilderness within Federal lands Important/ Very Important North 66% South 55% Great Plains 50% Rockies 59% Pacific Coast 59%
NSRE 2000 and Marketing Research • NSRE 2000 will ask knowledge, attitudes, sensitivities, uses, and values of wilderness across all of American society, from the Keys to the ANWR. • Segment the public using differences in environmental attitudes, recreation participation patterns, lifestyles, demographics and region of the country • Use significant factors in the design of tailored marketing and educational strategies.
Segmenting the American Public • Education, outreach, involvement – “Does one Size Fit All?” • Outdoor Recreation Is a Path to Different Segments • Eight Groups, Eight Lifestyles
Segmenting for more effective interpretation and education The Urban Beach Boys (3.8%) Young New England Wind Surfers (0.9%) The Inactives (22.0%) Nature Lovers (27.2%) The Noreaster Musclers (6.2%) The Thrill Seekers (8.3%) Hunt-n-Fish Men’s Motor Club (6.3%) The Take it Easies (25.3%)
Nature Lovers (27.2%) • Viewing/photographing birds, flowers, wildlife, fish, natural scenery, and gathering mushrooms and berries, and learning in nature centers, visitor centers, historic sites and archeological sites • Not into hunting, fishing, active sports or motorized activities • 61 % female, mostly white, middle aged and seniors, not foreign born • New England and Prairie states well represented • Donate to civic or charitable organizations, spend time with grand children, invest, creative arts, collect things and garden, and read environmental magazines • Aware of the NWPS, cross-section of American’s values regarding wilderness, especially future options • Believe humans are abusing the earth, the balance is delicate, and we are on a course for catastrophe
Hunt-n-Fish Men’s Motor Club (6.3%) • Hunt, fish, motorized, camp, motorboat, canoe • Don’t participate in beach activities or much in viewing/learning • 88% male, 90% white, under 45, U.S. born, much more rural, Prairie and Southern • Belong to wildlife conservation group, read nature magazines, woodworking, own a business, garden, have pets and do home improvements • Believe Wilderness is there to use • Humans were meant to rule over the earth and environmental crisis is exaggerated
The Urban Beach Boys (3.8%) • Diving, Surfing, Snorkeling, Kayaking, Sailing, Backpacking, Snowboarding, Saltwater Fishing, Water Skiing, More active than most people in most activities, except hunting • Two-thirds white, Asian/Pacific Islanders well represented, majority under 35, U.S. born, and urban • South Atlantic and Pacific Coast • Regularly like to go to movies, use internet at home, participate in environmental groups, invest, and attend classes, involved as a youth volunteer, into the arts • Advocate wilderness preservation for option and existence values • Like most Americans feel humans are abusing the earth, we on a course for ecological catastrophe and the balance of nature is delicate