Download
1 / 55
550 likes | 554 Vues
This lecture provides a brief survey of Earth's atmosphere, including its origins, vertical structure of composition, air pressure, temperature, and the ionosphere. It also explores the thickness and dominant gases, such as hydrogen and helium, in the atmosphere. Additionally, it discusses the role of water vapor, carbon dioxide, nitrogen, oxygen, and argon, as well as the importance of permanent and variable gases in weather and climate.

E N D
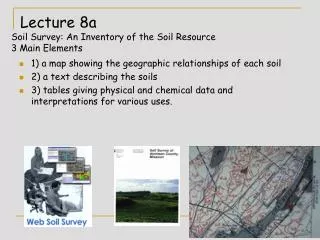
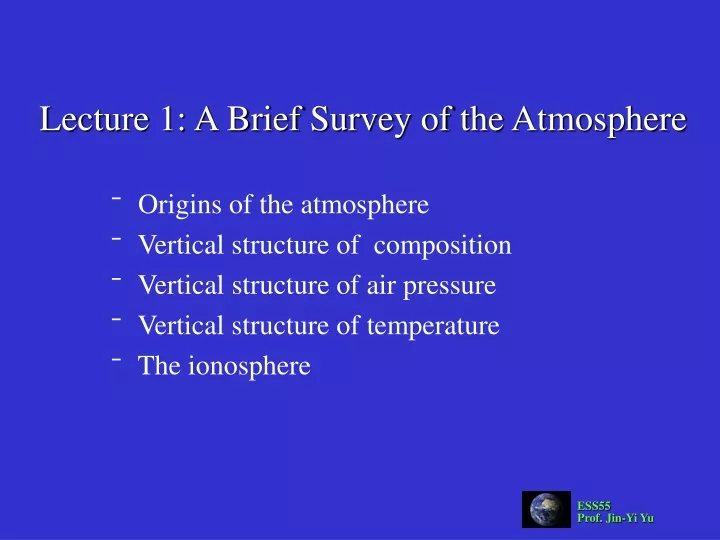
Lecture 1: A Brief Survey of the Atmosphere • Origins of the atmosphere • Vertical structure of composition • Vertical structure of air pressure • Vertical structure of temperature • The ionosphere
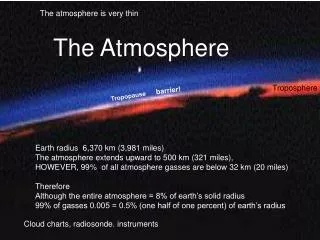
Thickness of the Atmosphere (from Meteorology Today) 90% • The thickness of the atmosphere is only about 2% of Earth’s thickness (Earth’s radius = ~6400km). • Most of the atmospheric mass is confined in the lowest 100 km above the sea level. 70% • Because of the shallowness of the atmosphere, its motions over large areas are primarily horizontal. • Typically, horizontal wind speeds are a thousands time greater than vertical wind speeds. (But the small vertical displacements of air have an important impact on the state of the atmosphere.)
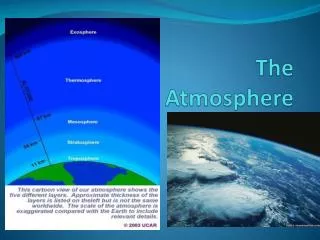
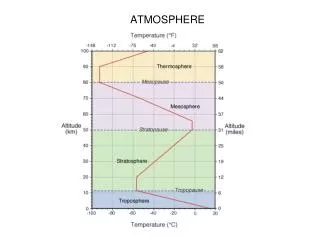
Vertical Structure of the Atmosphere composition temperature electricity 80km (from Meteorology Today)
Vertical Structure of Composition up to ~500km Dominated by lighter gases with increasing altitude, such as hydrogen and helium. Heterosphere ~80km This part of the atmosphere continually circulates, so that the principal atmospheric gases are well mixed. For most purpose, we consider the homosphere virtually the entire atmosphere. Homosphere
Composition of the Atmosphere (inside the DRY homosphere) Water vapor (0-0.25%) (from The Blue Planet)
Origins of the Atmosphere • When the Earth was formed 4.6 billion years ago, Earth’s atmosphere was probably mostly hydrogen (H) and helium (He) plus hydrogen compounds, such as methane (CH4) and ammonia (NH3). • Those gases eventually escaped to the space. • The release of gases from rock through volcanic eruption (so-called outgassing) was the principal source of atmospheric gases. • The primeval atmosphere produced by the outgassing was mostly carbon dioxide (CO2) with some Nitrogen (N2) and water vapor (H2O), and trace amounts of other gases.
What Happened to H2O? • The atmosphere can only hold small fraction of the mass of water vapor that has been injected into it during volcanic eruption, most of the water vapor was condensed into clouds and rains and gave rise to rivers, lakes, and oceans. The concentration of water vapor in the atmosphere was substantially reduced. (from Atmospheric Sciences: An Introductory Survey)
Saturation Vapor Pressure • Saturation vapor pressure describes how much water vapor is needed to make the air saturated at any given temperature. • Saturation vapor pressure depends primarily on the air temperature in the following way: • Saturation pressure increases exponentially with air temperature. The Clausius-Clapeyron Equation L: latent heat of evaporation; : specific volume of vapor and liquid
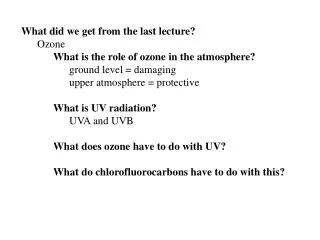
What happened to CO2? • Chemical weather is the primary process to remove CO2 from the atmosphere. • In this process, CO2 dissolves in rainwater producing weak carbonic acid that reacts chemically with bedrock and produces carbonate compounds. • This biogeochemical process reduced CO2 in the atmosphere and locked carbon in rocks and mineral. (from Earth’s Climate: Past and Future)
Carbon Inventory (from Atmospheric Sciences: An Introductory Survey)
What Happened to N2? • Nitrogen (N2): (1) is inert chemically, (2) has molecular speeds too slow to escape to space, (3) is not very soluble in water. • The amount of nitrogen being cycled out of the atmosphere was limited. • Nitrogen became the most abundant gas in the atmosphere.
Where Did O2 Come from? • Photosynthesis was the primary process to increase the amount of oxygen in the atmosphere. • Primitive forms of life in oceans began to produce oxygen through photosynthesis probably 2.5 billion years ago. • With the concurrent decline of CO2, oxygen became the second most abundant atmospheric as after nitrogen. (from Earth’s Climate: Past and Future)
Where Did Argon Come from? • Radioactive decay in the planet’s bedrock added argon (Ar) to the evolving atmosphere. Argon became the third abundant gas in the atmosphere.
Permanent and Variable Gases Those gases that form a constant portion of the atmospheric mass. Those gases whose concentrations changes from time to time and from place to place, and are important to weather and climate.
Water Vapor (H2O) • Water vapor is supplied to the atmosphere by evaporation from the surface and is removed from the atmosphere by condensation (clouds and rains). • The concentration of water vapor is maximum near the surface and the tropics (~ 0.25% of the atmosphere) and decreases rapidly toward higher altitudes and latitudes (~ 0% of the atmosphere). • Water vapor is important to climate because it is a greenhouse gas that can absorb thermal energy emitted by Earth, and can release “latent heat” to fuel weather phenomena.
Carbon Dioxide (CO2) (Mauna Loa, Hawaii) Early spring maximum: takes less CO2 due to slow plant growth in winter plus CO2 produced from tree leave decomposing. current level • Carbon dioxide is supplied into the atmosphere by plant and animal respiration, the decay of organic material, volcanic eruptions, and natural and anthropogenic combustion. • Carbon dioxide is removed from the atmosphere by photosynthesis. • CO2 is an important greenhouse gas. 1.8 ppm per year Late summer minimum: summer growth removes CO2 from the atmosphere. (from Understanding Weather & Climate)
Formation of Ozone (O3) • With oxygen emerging as a major component of the atmosphere, the concentration of ozone increased in the atmosphere through a photodissociation process. (from WMO Report 2003)
Ozone (O3) “good” ozone ~ 15ppm “bad” ozone ~ 0.15ppm (from WMO Report 2003)
Other Atmospheric Constituents • Aerosols: small solid particles and liquid droplets in the air. They serve as condensation nuclei for cloud formation. • Air Pollutant: a gas or aerosol produce by human activity whose concentration threatens living organisms or the environment.
Air Pressure Can Be Explained As: weight of the air motion of air molecules The weight of air above a surface (due to Earth’s gravity) The bombardment of air molecules on a surface (due to motion)
Air Pressure and Air Density • Weight = mass x gravity • Density = mass / volume • Pressure = force / area = weight / area (from Meteorology Today)
How Soon Pressure Drops With Height? Ocean Atmosphere (from Is The Temperature Rising?) • In the ocean, which has an essentially constant density, pressure increases linearly with depth. • In the atmosphere, both pressure and density decrease exponentially with elevation.
One Atmospheric Pressure • The average air pressure at sea level is equivalent to the pressure produced by a column of water about 10 meters (or about 76 cm of mercury column). • This standard atmosphere pressure is often expressed as 1013 mb (millibars), which means a pressure of about 1 kilogram per square centimeter. (from The Blue Planet)
Units of Atmospheric Pressure • Pascal (Pa): a SI (Systeme Internationale) unit for air pressure. 1 Pa = a force of 1 newton acting on a surface of one square meter 1 hectopascal (hPa) = 1 millibar (mb) [hecto = one hundred =100] • Bar: a more popular unit for air pressure. 1 bar = a force of 100,000 newtons acting on a surface of one square meter = 100,000 Pa = 1000 hPa = 1000 mb • One atmospheric pressure = standard value of atmospheric pressure at lea level = 1013.25 mb = 1013.25 hPa.
Air Mass and Pressure • Atmospheric pressure tells you how much atmospheric mass is above a particular altitude. • Atmospheric pressure decreases by about 10mb for every 100 meters increase in elevation. (from Meteorology Today)
Units of Air Temperature • Fahrenheit (ºF) • Celsius (ºC) ºC = (ºF-32)/1.8 • Kelvin (K): a SI unit K= ºC+273 1 K = 1 ºC > 1 ºF
“Absolute Zero” Temperature • The absolute zero temperature is the temperature that the molecules do not move at all. • This temperature occurs at –273°C. • The Kelvin Scale (K) is a new temperature scale that has its “zero” temperature at this absolute temperature: K = °C + 273 (from Is The Temperature Rising?)
Vertical Thermal Structure Troposphere (“overturning” sphere) • contains 80% of the mass • surface heated by solar radiation • strong vertical motion • where most weather events occur Stratosphere (“layer” sphere) • weak vertical motions • dominated by radiative processes • heated by ozone absorption of solar ultraviolet (UV) radiation • warmest (coldest) temperatures at summer (winter) pole Mesosphere • heated by solar radiation at the base • heat dispersed upward by vertical motion Thermosphere • very little mass Standard Atmosphere middle atmosphere (from Understanding Weather & Climate) lapse rate = 6.5 C/km
Variations in Tropopause Height (from The Atmosphere)
Dry Adiabatic Lapse Rate (from Meteorology: Understanding the Atmosphere)
Moist Adiabatic Lapse Rate (from Meteorology: Understanding the Atmosphere)
Stratosphere Standard Atmosphere • The reasons for the inversion in the stratosphere is due to the ozone absorption of ultraviolet solar energy. • Although maximum ozone concentration occurs at 25km, the lower air density at 50km allows solar energy to heat up temperature there at a much greater degree. • Also, much solar energy is absorbed in the upper stratosphere and can not reach the level of ozone maximum. (from Understanding Weather & Climate) lapse rate = 6.5 C/km
Ozone Distribution • The greatest production of ozone occurs in the tropics, where the solar UV flux is the highest. • However, the general circulation in the stratosphere transport ozone-rich air from the tropical upper stratosphere to mid-to-high latitudes. • Ozone column depths are highest during springtime at mid-to-high latitudes. • Ozone column depths are the lowest over the equator. Antarctic Ozone Hole (from The Earth System)
Temperatures in Stratosphere Northern Winter Northern Summer mesosphere stratosphere (from Dynamic Meteorology)
Mesosphere Standard Atmosphere • There is little ozone to absorb solar energy in the mesosphere, and therefore, the air temperature in the mesosphere decreases with height. • Also, air molecules are able to lose more energy than they absorb. This cooling effect is particularly large near the top of the mesosphere. (from Understanding Weather & Climate) lapse rate = 6.5 C/km
Thermosphere Standard Atmosphere • In thermosphere, oxygen molecules absorb solar rays and warms the air. • Because this layer has a low air density, the absorption of small amount of solar energy can cause large temperature increase. • The air temperature in the thermosphere is affected greatly by solar activity. (from Understanding Weather & Climate) lapse rate = 6.5 C/km
Ionosphere • The ionosphere is an electrified region within the upper atmosphere where large concentration of ions and free electrons exist. • The ionosphere starts from about 60km above Earth’s surface and extends upward to the top of the atmosphere. Most of the ionosphere is in the thermosphere. • The ionosphere plays an important role in radio communication. (from Meteorology Today)
Ionosphere and AM Radio • The D- and E-layers absorb AM radio, while the F-layer reflect radio waves. • When night comes, the D-layer disappears and the E-layer weakens. Radio waves are able to reach the F-layer and get reflected further. • The repeated refection of radio waves between Earth surface and the F-layer allows them to overcome the effect of Earth’s curvature. (from Understanding Weather & Climate)
Weather Maps • Many variables are needed to described weather conditions. • Local weathers are affected by weather pattern. • We need to see all the numbers describing weathers at many locations. • We need weather maps. • “A picture is worth a thousand words”. (from Understanding Weather & Climate)
The Station Model • Meteorologists need a way to condense all the numbers describing the current weather at a location into a compact diagram that takes up as little space as possible on a weather map. • This compressed geographical weather report is called a station model. (from Meteorology: Understanding the Atmosphere)
Weather Map on 7/7/2005 (from Meteorology: Understanding the Atmosphere)
Isobar • It is useful to examine horizontal pressure differences across space. • Pressure maps depict isobars, lines of equal pressure. • Through analysis of isobaric charts, pressure gradients are apparent. • Steep (weak) pressure gradients are indicated by closely (widely) spaced isobars.
The Station Model: Cloudiness (from Meteorology: Understanding the Atmosphere)
The Station Model: Wind Wind speed is indicated to the right (left) side of the coming wind vector in the Northern (Southern) Hemisphere (Northeasterly wind) 50 5 10 15 • Wind speeds are indicated in units of “knot”. • 1 international knot • = 1 nautical mile per hour (exactly), • = 1.852 kilometres per hour (exactly), • = 0.514 meters per second, • = 1.15077945 miles per hour (approximately)
The Station Model: Pressure • The pressure value shown is the measured atmospheric pressure adjusted to sea level. • The units used are “mb”. • To save space, the “thousand” and the “hundred” values, and the decimal point are dropped. So “138” means 1013.8 mb To decode the value of pressure on the station model, add a 9 if the first number is 7, 8, or 9; otherwise add a 10.
Pressure Correction for Elevation • Pressure decreases with height. • Recording actual pressures may be misleading as a result. • All recording stations are reduced to sea level pressure equivalents to facilitate horizontal comparisons. • Near the surface, the pressure decreases about 100mb by moving 1km higher in elevation.
The Station Model: Pressure Tendency • The change in surface pressure in the past three hours is plotted numerically and graphically on the lower right of the station model. The pressure rose and then fell over the past three hours, a total change of 0.3 mb.
The Station Model: Dew Point Temperature • Dew point temperature (in united of ºF) indicates the moisture content. • A higher value indicates a larger amount of moisture.
Saturation Vapor Pressure • Saturation vapor pressure describes how much water vapor is needed to make the air saturated at any given temperature. • Saturation vapor pressure depends primarily on the air temperature in the following way: • Saturation pressure increases exponentially with air temperature. The Clausius-Clapeyron Equation L: latent heat of evaporation; : specific volume of vapor and liquid