Download
1 / 26
260 likes | 262 Vues
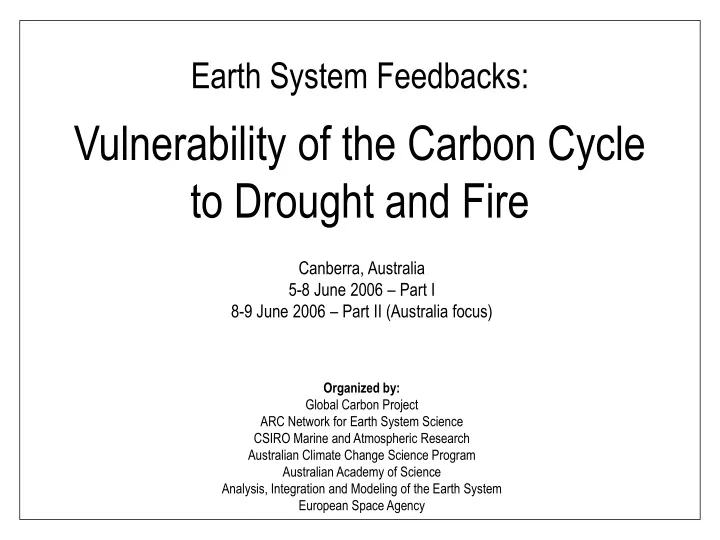
Earth System Feedbacks: Vulnerability of the Carbon Cycle to Drought and Fire. Canberra, Australia 5-8 June 2006 – Part I 8-9 June 2006 – Part II (Australia focus) Organized by: Global Carbon Project ARC Network for Earth System Science CSIRO Marine and Atmospheric Research

E N D
Earth System Feedbacks:Vulnerability of the Carbon Cycle to Drought and Fire Canberra, Australia 5-8 June 2006 – Part I 8-9 June 2006 – Part II (Australia focus) Organized by: Global Carbon Project ARC Network for Earth System Science CSIRO Marine and Atmospheric Research Australian Climate Change Science Program Australian Academy of Science Analysis, Integration and Modeling of the Earth System European Space Agency
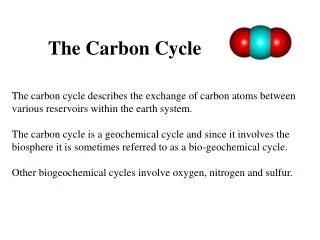
The Earth System Science Partnership Carbon-Climate-Human system
GCP Science Framework 1. Patterns and Variability 2. Mechanisms & Feedbacks • 2.1. Integrated C Sink Mechan. • 2.2. Emergent Properties of the • Carbon-Climate system • 2.3. Vulnerabilities of the C-C-H • 1.1.Enhancing Observations • 1.2. Model-data Synthesis • 1.3 Carbon Budgets 3. Carbon Management • 3.1. Mitigation Options • 3.2. Carbon Management & • Sustainability • 3.3. Regional/Urban Develop.
2006/07 Vulnerability of the Carbon Cycle in the 21st Century Hot Spots of the Carbon-Climate System Land Permafrost Oceans HL Peatlands CH4 HydratesBiological Pump Solubility Pump T Peatlands Veg.-Fire/LUC Field and Raupach 2004 Canadell et al. 2006 Many Pools and Processes not included in Earth System models
Vulnerability of the Carbon Cycle in the 21st Century Hot Spots of the Carbon-Climate System 400 Pg C - frozen soils vulnerable to warming >400 Pg C - frozen sediments vulnerable to warming Land Permafrost Oceans HL Peatlands CH4 HydratesBiological Pump Solubility Pump T Peatlands Veg.-Fire/LUC Field and Raupach 2004 Canadell et al. 2006 Many Pools and Processes not in included in Earth System models
Vulnerability of the Carbon Cycle in the 21st Century Hot Spots of the Carbon-Climate System Photo: Erkki Oksanen 400 Pg C – cold peatlands vulnerable to climate change Land Permafrost Oceans HL Peatlands 100 Pg C – tropical peatlands vulnerable to land use and climate change CH4 HydratesBiological Pump Solubility Pump T Peatlands Veg.-Fire/LUC Field and Raupach 2004 Canadell et al. 2006 Many Pools and Processes not in included in Earth System models
Vulnerability of the Carbon Cycle in the 21st Century >500 Pg C vegetation and soils vulnerable to drought x land use x fire Hot Spots of the Carbon-Climate System Land Permafrost Oceans HL Peatlands CH4 HydratesBiological Pump Solubility Pump T Peatlands Veg.-Fire/LUC Field and Raupach 2004 Canadell et al. 2006 Many Pools and Processes not in included in Earth System models
Trends in C Emissions from Fires 3500 3000 total 2500 Tg C yr-1 1800 tropical savanna 1400 1000 temperate forest tropical forest 600 200 boreal forest Mouillot et al. 2006 1995 1905 1925 1945 1965
Carbon-Climate Feedbacks 10 GCMs with coupled carbon cycle Difference Coupled-Uncoupled Atmospheric CO2 (ppm) 0.1°C to 1.5 °C 20 to 200 ppm Friedlingstein et al. 2006
Fossil Fuel + Land Use Change Scenarios (IPCC SRES) CO2 Concentrations ~250 ppm IPCC SRES 2000; IPCC TAR 2001
Boreal Fires 2003 Heat Wave Boreal Forest NH Drought WC Forest Savanna Borneo Peatlands Drought and Land Use Drought and Fire Savanna Temp. Plantations SE Forest Examples of vulnerable C pools to drought of global significance
Carbon Emissions from Tropical Peatlands – Borneo Spessa et al., in preparation
6 2004 2003 2002 ) -1 4 d -2 CO2 source 2 NEE (gC m 0 CO2 sink -2 Dec. Jun. Dec. Jun. Dec. Jun. Dec. Month Carbon Emissions from Tropical Peatlands – Borneo Annual C Emissions from peat fires Spessa et al., in preparation Hirano et al., in preparation
Northern Hemisphere Forest Sinks - Disturbances Pg C yr-1 Goodale et al. 2002
10 8 6 4 2 0 1920 1940 1960 1980 2000 ClearCut Fire Insects Total Canadian Forest Net Carbon Uptake Disturbed Area (M ha) 400 300 Land Uptake (Tg C /yr-1) 200 100 0 -100 -200 1920 1940 1960 1980 2000 Kurz & Apps 1999 Variable Temp Constant Temp
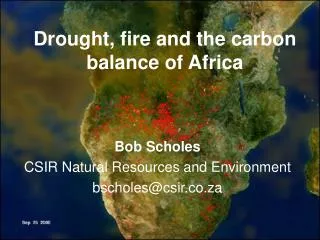
Climate Variability Effects on the C Sink Angert et al. 2005; Dai et al. 2005
2003 Heat Wave in Europe The largest productivity crash of the past 100 years 30% Reduction of GPP 0.5PgC Net source of CO2 4years Equivalent C sink Model NPP gCm-2 mo CO2 Anomaly Ciais et al. 2005, Peylin et al., unpublished
c a r b o n 380 p ( o i t 360 a r g n i x i m 340 2.5 ) r y / 2.0 m p p ( e 1.5 t a r h t w 1.0 o r g 0.5 1970 1975 1980 1985 1990 1995 2000 2005 2010 Annual Mean CO2 at Cap Grim (Tasmania) d i o x i d e ( C O ) 2 0 . 5 4 % / y r 2005 Global Average: 279 ppm CO2 concentration (ppm) B e r n r e f . m o d e l El Nino Drought growth rate increased by 70% over last 30 years Growth Rate (ppm yr-1) La Nina Pinotubo La Nina Paul Fraser, unpublished
Revised Global Carbon Budget 1980-2005 1980’s 1990’s 2000-2005 Atmospheric Increase 3.3±0.1 3.2±0.1 4.1±0.1 Emissions (FF) 5.4±0.3 6.4±0.3 7.0±0.3 Net Ocean-Atmosph. Flux -1.8±0.8 -2.2±0.4 -2.2±0.5 Net Land-Atmosph. Flux -0.3±0.9 -1.0±0.5 -0.7±0.5 Land Use Change 1.3 1.6 NA Residual Land Sink -1.6 -2.6 NA (-3.8 to 0.3) (-4.3 to 1.0) GCP, IPCC in preparation
21st Century Projections of Terrestrial C Uptake 10 Carbon Coupled GCMs – C4MIP 6 Dynamic Global Vegetation Models Land Uptake (Pg C yr-1 Cramer et al. 2001, IPCC TAR 2001, Friedlingstein et al. 2006, in press
Scope of the Workshop Will changes in the hydrological cycle, particularly drought characteristics (intensity, frequency, long-term trends) weaken the terrestrial C sink? What are the consequences of the perturbation of the carbon-water system for regional and global management?
Workshop Themes Theme 1: Observations Climate and Vegetation Theme 2: Processes and Controls of the Coupled Carbon-Water System Theme 3: Modeling Carbon-Water Interactions Theme 4: Vulnerability of Ecosystems Services
Outcomes • Current evidence and understanding of impacts of drought on the strength of the terrestrial C sink and their underlaying drivers. • Implications for global and regional management of the carbon-water system. • Identification of key research areas to advance in this field.
Products • A synthesis paper on the state-of-the-art understanding on the drought-C sink issue. • Short ms. for EOS, Science, Nature, others, … • A synthesis paper on the state-of-the-art understanding on management of the carbon-water system. • Ecological Applications, others, … • Special Feature or Special Issue if enough interest exist. • Rapid Web Based Journals • Biogeoscience (EGU, AGU) • Carbon Balance and Management • Global Change Biology • Ecological Applications • Climatic Change • Others
Structure of the Workshop 20 minute talks 10 minute for questions 1 hour after each theme Wednesday afternoon 4 hours – products and ms. outlines Thursday morning Overlap with a National Workshop Thursday afternoon to Friday National Workshop Thursday afternoon Trip to Namagi