Download
1 / 21
210 likes | 376 Vues
What does delta band tell us about cognitive processes: A mental calculation study. Stavros I. Dimitriadis , Nikolaos A. Laskaris, Vasso Tsirka, Michael Vourkas, Sifis Micheloyannis. Electronics Laboratory, Department of Physics, University of Patras, Patras 26500, Greece

E N D
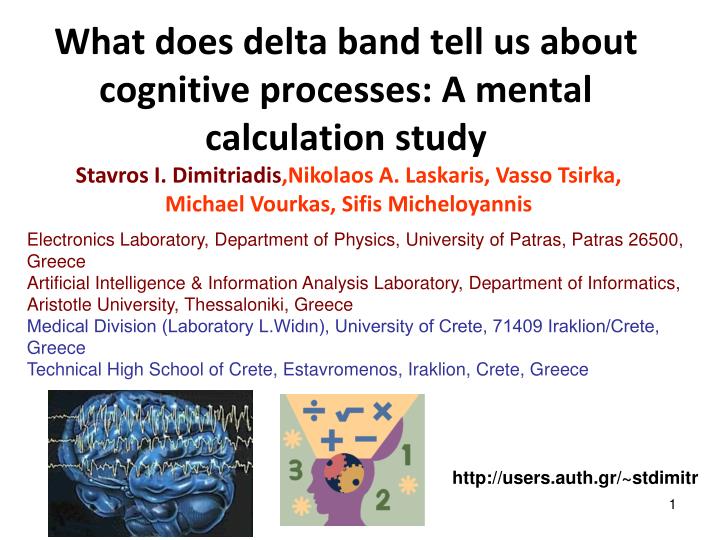
What does delta band tell us about cognitive processes: Amentalcalculation study Stavros I. Dimitriadis,Nikolaos A. Laskaris, Vasso Tsirka, Michael Vourkas, Sifis Micheloyannis Electronics Laboratory, Department of Physics, University of Patras, Patras 26500, Greece Artificial Intelligence & Information Analysis Laboratory, Department of Informatics, Aristotle University, Thessaloniki, Greece Medical Division (Laboratory L.Widιn), University of Crete, 71409 Iraklion/Crete, Greece Technical High School of Crete, Estavromenos, Iraklion, Crete, Greece http://users.auth.gr/~stdimitr
Outline Introduction -Multichannels EEG recordings -math calculations (comparison and multiplication) -delta activity (cognition and relation to the difficulty of the task -DMN (default mode network) Methodology -fourdelta sub-bands (0.78 – 3.96 Hz) -Signal Power (SP) (derived via squaring and averaging the filtered EEG data) -network analysis (clustering coefficient (C) + path length (L)) -Small-World theory (γ,λ,σ)
Outline Results Conclusions
Mathematical thinking, as a cognitive process, activates local and spatially distributed cortical networks Exact calculationsare correlated with language function activating language specificregions located in the left hemisphere Duringmental calculations different processes are necessary, such as the -recognition of the numbers in their Arabic form, -the comprehensionof verbal representation of numbers, -the assignment of magnitudesto numerical quantities, -attention, memory, and other morespecialized processes During difficultmathcalculations, additional cortical regions, particularly of the lefthemisphere, show increased activation. These calculations demandretrieval of simple mathematical fact
Motivation Most widely studied bands are theta, alpha, beta and lower gamma Delta and higher gamma activity have been examined less due to artifact contamination We intended not only to replicate the previous findings but also to promote the understanding about the significance of this slow band in math calculation An increase of delta activity has been reported (Dolce & Waldeier,1974,Harmony et al., 1996)
Outline of our methodology The employment of narrow subbands gave us the opportunity to distinquish the actual brain activity from eye movement related activity, which is equally visible in all frequency range Calculation of SP for each recording site Based on EEG activity and the network of electrodes the notion of functional connectivity graph (FCG) topology, is utilized to identify different modes of brain’s self organization. Network analysisis performed for each subject/task and the inter-taskcomparison reveals significant differences between the two cognitive tasks
Data acquisition: Math Experiment 18 subjects 30 EEG electrodes Horizontal and Vertical EOG Trial duration: 3 x 8 seconds Single trial analysis 3 Conditions: Control Comparison Multiplication The recording was terminated when at least an EEG-trace without visible artifacts had been recorded for each condition
Filtering Using a zero-phase band-pass filter (3rd order Butterworth filter), signals were extracted within four different narrow bands (0.78-3.9 Hz was divided into non-overlapping subbands, each of 0.78 Hz width) Artifact Correction Working individually for each subband and using EEGLAB (Delorme & Makeig,2004), artifact reduction was performed using ICA -Components related to eye movementwere identified based on their scalp topography which includedfrontal sites and their temporal course which followed the EOGsignals. -Components reflecting cardiac activity were recognized from the regular rythmic pattern in their time course widespread in the corresponding ICA component.
Signal Power (SP) Calculation of SP for each recording site The SP values corresponding to each single electrode were contrasted for every subband and additionally the whole delta-band. Significant changes were captured via one-tailed paired t-tests (p < 0.001). Τhe functional connectivity graph (FCG) describes coordinated brain activity In order to setup the FCG, we have to establish connections between the nodes (i.e. the 30 EEG electrodes). Phase synchronization, is a mode of neural synchronization, that can be easily quantifiedthrough EEG signals
Phase-locking Value (PLV) PLV quantifies the frequency-specific synchronization between two neuroelectric signals (Mormann et al., 2000 ; Lachaux et. al. 1999). We obtain the phase of each signal using the Hilbert transform. (t, n)is the phase difference φ1(t, n) - φ2(t, n)between the signals. PLV measures the inter-trial variability of this phase difference at t. If the phase difference varies little across the trials, PLV is close to 1; otherwise is close to 0
PLV procedure for a pair of electrodes Adopted from Lachaux et al,1999
Building the FCG Establishing links for a single electrode 0.9 0.6 The process is repeated for every electrode, creating a complete graph.
Surrogate Analysis -To detect significant connections, we utilized surrogate datato form a distribution of PLI values, for each electrode-pair separately,that corresponds to the case in which there is no functionalcoupling - Functional connections that showed significant differences, with respect to the distribution of PLI values generated by a randomization procedure corresponding to each electrodepair,were only considered. -Since our analysis was based on a singlesweep, we shuffled the time series of the second electrode for eachpair (in contrast to the case of multiple trials where one shufflesthe trials of the second electrode as described in Lachaux et al., 2000).
5% Nonparametric Null Distribution Surrogate Analysis -Finally, theoriginal PLI values were compared against the emerged baselinedistribution (surrogate data) and this comparison was expressedvia a p-value which was set at p < 0.001. -Graph edges where theabove criterion was not met, were assigned a zero-weighted link.
Network Analysis The clustering coefficientC of network is defined as : in which ki is the degree of the current node The characteristic path lengthLis defined (through integration across all nodes) as:
Small – World network measures -We rewired each network 1000 times using the algorithm proposed in (Maslov & Sneppen, 2002) -Derived Cr and Lr as the averages corresponding to the ensemble of randomized graphs. The two (normalized) ratios γ= C/Cr and λ= L/Lr were used in the summarizing measureof “small-worldness”, defined as σ= γ/λ, which becomes greaterthan 1 in the case of networks with small-world topology -The above described computations were performed for each subject separately - Results were employed todetect systematic trends, via statistical comparison amongdifferent tasks (comparison–control, multiplication–control,comparison–multiplication), across subjects.
Small – World network measures The three graph metrics (γ,λ and σ ) were contrasted, forevery subband, in a similar manner via paired t-test. Recording Montage -The selected data had been originally recorded based on amontageusing a common reference electrode. -Since, this selectioncould influence significantly the subsequent computations of SPand phase-synchrony we additionally re-reference the data. -Using average-reference, we repeated the above described calculations. - We mention the observed differences and commonalities.
Signal Power (SP) Bi-color (black and grey) circles denote the sites where significant increase isobserved before, but not afteraverage re-referencing Αll subbands show widespread SP-increase during math Higher SPvalues of delta rhythm are seen over regions of the left hemisphereduring multiplication in contrast to the number comparison
Network Analysis Simultaneously,all subbands show small-world network characteristicsi.e. optimum organization. The (normalized) clusteringcoefficient and the (normalized) path length are higher during multiplication,for networkscorresponding to those subbands whichshowed significant inter-task SP-differences. These findings couldbe considered as the result of increased nodal (local) activity andless efficient remote connections within the corresponding brain networks.
Conclusions We investigate brain activity in four sub-bands during math calculation. We characterize EEG recorded brain activity (Related to any particular cognitive task and the four sub-bands) Based on functional connectivity graphs Artifact contamination (occulographic and myographic activity) can be overcomed using sub-bands + ICA. Our methodology offers novel knowledge about delta activity during math calculation and the nodal organization of the related FCGs. The changes in SP and network organization related to delta rhythm could be possibly explained as the results of inhibitory mechanisms reflecting the deactivation of the default network.