Download
1 / 73
910 likes | 1.7k Vues
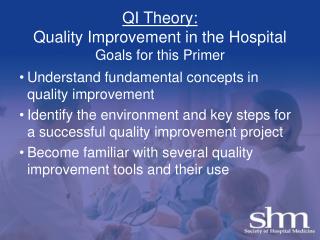
Highest Quality Care for the Hospitalized Elderly. Quality Improvement in the Hospital. Jason Stein, MD Emory Reynolds Faculty Scholar Emory Hospital Medicine Service. Quality Improvement in the Hospital: Goals for this Primer. Understand fundamental concepts in quality improvement

E N D
Highest Quality Care for the Hospitalized Elderly Quality Improvement in the Hospital Jason Stein, MD Emory Reynolds Faculty Scholar Emory Hospital Medicine Service
Quality Improvement in the Hospital:Goals for this Primer • Understand fundamental concepts in quality improvement • Identify the environment and key steps for a successful quality improvement project • Become familiar with several quality improvement tools and their use Emory Reynolds Program Emory Hospital Medicine Service
Processes Outcomes Highest Quality Hospital Care What do you care more about?
Optimal Process: identify correctable problem identify preventable problem Optimal Outcome: correct correctable problem prevent preventable problem Highest Quality Hospital Care
Processes Physicians Highest Quality Hospital Care vs Is one more effective?
Processes Physicians Highest Quality Hospital Care vs Is one more reliable?
Processes Physicians Highest Quality Hospital Care vs If your hospital lacks a specific process to drive a specific outcome, do individual physicians fill the gap?
Progress Patient care Time Quality Improvement: Bridging the Implementation Gap How good is American healthcare?
Progress Patient care Time Quality Improvement: Bridging the Implementation Gap We get it right 54% of the time. -Brent James, MD, MStat Executive Director, Intermountain Health Care
Scientific understanding Implementation Gap Progress Patient care Time Quality Improvement: Bridging the Implementation Gap
Hospitalists and Quality Improvement • Complex process problems need multidisciplinary solutions • We are at the frontlines seeing system failures, process errors, and performance gaps with our own eyes -- which is our competitive advantage • Improved quality delivers: • better patient care… • at lower costs… • with potentially higher reimbursements (pay-for-performance)… And it can make our jobs more interesting, fun, and rewarding.
Section I: Quality Improvement and Change in the Hospital Atmosphere
Definition of Quality • Meeting the needs and exceeding the expectations of those we serve • Delivering all and only the care that the patient and family needs
“Definition” of Improvement • It is NOT… • yelling at people to work harder, faster, or safer • creating order sets or protocols and then failing to monitor their use or effect • traditional Quality Assurance • research (but they can co-exist nicely)
Principle #1:Improvement Requires Change Every system is perfectly designed to achieve exactly the results it gets To improve the system, change the system…
Principle #2:Less is More You cannot destroy productivity When changing the system, keep it simple
Illustrating Principle #2: Less Is MoreProbability of Performing Perfectly
Understanding Change in the Hospital Atmosphere • Change = not just doing something different, but engineering something different • at least one step in at least one process • Hospital Atmosphere = hospitals tend to be viscous, complex systems with default levels of performance • change engineered to improve performance can be a foreign concept - or even overtly resisted
Understanding Change in the Hospital Atmosphere A Common Strategy Which Commonly Fails: • Experts design a comprehensive protocol using EBM over several months • Protocol is presented as a finished, stand alone product • Customization of protocol is discouraged • Compliance depends on vigilance and hard work • Monitoring for success or failure is the exception to the rule (with failures coming to light after patients are harmed) • Flawed implementation leads to repetitive efforts down the road
Understanding Change in the Hospital Atmosphere High-Reliability Strategies Commonly Succeed: • Build a “decision aide” or reminder into the system • Make the desired action the default action (not doing the desired action requires opting out) • Build redundancy into responsibilities (e.g. if one person in the chain overlooks it, someone else will catch it) • Schedule steps to occur at known intervals or events • Standardize a process so that deviation feels weird • Take advantage of work habits or reliable patterns of behavior Build at least one - if not more - of these high-reliability strategies into any changed process.
Understanding Change in the Hospital Atmosphere Change engineered to drive improvement depends on… • Workplace Culture: personnel must be receptive to change • Awareness: administrative and medical staffs must care about performance and support its improvement through change • Evidence: local experts must identify which research to translate into practice • Experience: a skilled team must choose, implement, and follow up changes to ensure: 1) improvement efforts are ongoing and yielding better performance 2) productivity is preserved
An Atmosphere for Change AWARENESS OFTHE LOCAL PERFORMANCE GAP Patient Medical Staff Hospital Administration Patient At mercy and increasingly aware of underperforming status quo Now can access a new resource promoting transparency in hospital performance: www.hospitalcompare.hhs.gov Hospital Administration Understands status quo is unacceptable (IOM, Leapfrog, NQF, JCAHO) Sees fiscal health tied to performance against national benchmarks, ability to reduce costs & LOS, improve margins, and competitive reputation in the community Medical Staff Has professional responsibility to improve Knows all too well where system fails Recognizes that professional livelihood will depend on paying attention to outcomes: Pay-for-Performance
An Atmosphere for Change EXPERIENCE WITHSIMILAR IMPROVEMENTEFFORTS Hospitalist Team Facilitator Multidisciplinary Team Members Successful Strategies of Others Hospitalist Team Facilitator Technical expert on Quality Improvement theory and tools Owns the team process, enforces ground rules, helps judge feasibility Teaches the team while doing Multidisciplinary Team Members Chosen for hands-on, fundamental knowledge of key processes Inclusive, open, & consensus seeking Impact not only the change(s) but the implementation Successful Strategies of Others Learn from mistakes of others Adapt successes of others (tools and methods): steal shamelessly Get specific advice in ’Ask the Expert’ forums or other consortiums that collect and share experience
An Atmosphere for Change EVIDENCE TO TRANSLATE INTO PRACTICE “Bedside” Teaching Didactic Teaching Sessions Local Expertise in Disease Literature “Bedside” Teaching To an audience of residents or students To build cadre of “experts” (and to help meet ACGME requirements) Download teaching pearls from SHM resource rooms Local Expertise in Disease Literature Decide what changes to make based on the level of evidence Establishes team’s credibility Extends team’s authority when local sub-specialists or experts participate in selecting and implementing change Didactic Teaching Sessions To an audience of peers, administrators, nurses, or support staff To boost awareness, knowledge, enthusiasm, and support Download slide sets from SHM resource rooms
An Atmosphere for Change WORKPLACE CULTURE READY TO ACCEPT CHANGE Task Load Culture of Improvement vs. Culture of Negative Expectations Task Load Be sensitive about piling new tasks onto over-tasked personnel Use the input of personnel who will be responsibile for implementing Make it easy and desirable to do the right thing Culture of Negative Expectations Overcome it, one person and one project at a time Attach pride to balance between performance successes and failures Consider using a ‘cultural survey’ to identify problems and address them through proper channels Culture of Improvement Extend it, one person and one project at a time Advertise successes Use or adapt this online ‘cultural survey:’ http://www.patientsafetygroup.org/program/step1c.cfm
Section II: The Multidisciplinary Team Defining an Approach to Change
The Driving Force for Change THEMULTIDISCIPLINARYTEAM Leverages frontline expertise and experience. Impacts not only the change/interventions, but also the implementation
The Driving Force for Change: The Multidisciplinary Team A team is not the same as a committee… Committee • individuals bring representation • productive capacity = single most able member Team • individuals bring fundamental knowledge • productive capacity = synergistic (more than the sum of all individual team members together)
The Driving Force for Change: The Multidisciplinary Team Features of a good team… • Safe (no ad hominem attacks) • Inclusive (values all potential contributors including diverse views; not a clique) • Open (considers all ideas fairly) • Consensus seeking
The Driving Force for Change: The Multidisciplinary Team Consensus… • definition: finding a solution acceptable enough that all members can support it; no member opposes it • It is not: • A unanimous vote (consensus may not represent everyone’s first priorities) • A majority vote (in a majority vote, only the majority gets something they are happy with; people in the minority may get something they don’t want at all, which is not what consensus is all about) • Everyone totally satisfied
The Driving Force for Change: The Multidisciplinary Team Three types of team members… 1) Team Leader 2) Team Facilitator 3) Process Owners (members with operational, hands-on fundamental knowledge of the process)
The Driving Force for Change: The Multidisciplinary Team Team Leader… • schedules and chairs team meetings • sets the agenda (printed at each meeting) • records team activities (working documents in binder) • reports to management (Steering Team) • often a member of Steering Team
The Driving Force for Change: The Multidisciplinary Team Team Facilitator… • owns the team process (enforces ground rules) • technical expert on QI theory and tools • assists Team Leader • teaches while doing, within team
The Driving Force for Change: The Multidisciplinary Team Process Owners… • chosen for fundamental knowledge • will help implement • should become leaders (so choose wisely)
The Driving Force for Change: The Multidisciplinary Team Team Ground Rules… • All team members and opinions are equal • Team members will speak freely and in turn • We will listen attentively to others • Each must be heard • No one may dominate • Problems will be discussed, analyzed, or attacked (not people) • All agreements are kept unless renegotiated • Once we agree, we will speak with "One Voice" (especially after leaving the meeting) • Honesty before cohesiveness • Consensus vs. democracy: each gets his say, not his way • Silence equals agreement • Members will attend regularly • Meetings will start and end on time
Will the team target ‘all’ patients in the inpatient bell curve, or just a sub-group considered ‘at-risk’ (depicted in the outlying tail)? Is the quality of inpatient care which is not in the tail somehow ‘acceptable?’ After Defining an Approach to Change Before Quality Assurance Bell Curve: Inpatient Population Tail worse better Quality
If the team can identify and define an inpatient sub-group ‘at-risk,’ then improvement efforts could conceivably focus just on these ‘at-risk’ patients - this is similar to traditional Quality Assurance. Note that even if tail events are eliminated, the quality of care for the rest of the inpatient population (depicted by the unchanged position and shape of the bell curve) does not improve at all. While the mean does move toward better care, this is due only to eliminating statistical outliers. After Defining an Approach to Change Before Quality Assurance Bell Curve: Inpatient Population worse better Quality Tail worse better Quality
If the team identifies a performance gap applicable to a wider patient population, the team may design changes in processes with the potential for dramatic effect: improvement and standardization in processes reduces variation (narrows the curve) and raises quality of care for all (shifts entire curve toward better care). This radical change is what defines Quality Improvement. After Defining an Approach to Change Before Quality Assurance Bell Curve: Inpatient Population worse better Quality Tail Quality Improvement better worse better Quality worse better Quality
Section III: Tools for Engineering Change
Engineering Change • Hospitals have two dynamic levels impacting performance: 1) Processes • tasks performed in series or in parallel, impacting patient care and potentially patient outcomes 2) Personnel • skilled people with hearts and minds, with variable levels of attention, time, and expertise
Engineering Change:What Variables Impact Quality Outcomes of Care? Structure Processes Outcomes of Care Outputs Inputs Steps • Inventory Methods • Coordination • Physician orders • Nursing Care • Ancillary staff • Housekeeping • Transport • Physiologic • parameters • Functional status • Satisfaction • Cost • Patients • Equipment • Supplies • Training • Environment
Personnel Engineering Change:What Variables Impact Quality Outcomes of Care? The two most dynamic levels impacting performance Processes Steps • Inventory Methods • Coordination • Physician orders • Nursing Care • Ancillary staff • Housekeeping • Transport
Engineering Change • Processes • all those affecting relevant aspects of patient care • clinical decision making, order writing, admission intake, medication delivery, direct patient care, discharge planning, PCP communication, discharge follow-up, etc
Engineering Change • Personnel • anybody who touches the patient or a relevant process in the system • departments, physicians, clerks, pharmacy, nursing, RT, PT/OT/ST, care technicians, phlebotomist, patient transport, administration
Engineering Change: The Multidisicplinary Team Asks “What?” • What? • is the right thing to do? • will make the system more effective?
Engineering Change: The Multidisicplinary Team Asks “Where?” • Where? • are the processes to improve? • Brainstorming • Multivoting & nominal group technique • Affinity grouping • do we start? (dissect and understand the processes) • Cause and effect diagrams (Ishikawa or ‘fishbone’ diagrams) • Tally sheets • Pareto charts • Flow (conceptual flow, decision flow) charts • Run charts • SPC charts • Scatter charts
Tools for Engineering Change: Cause-and-Effect Diagram • sometimes also called a ‘fishbone’ or Ishikawa diagram • graphically displays list of possible factors, focused on one topic or objective • used to quickly organize and categorize ideas during a brainstorming session, often as an interactive part of the session itself (the added organization can help produce balanced ideas during a brainstorming session)
Tools for Engineering Change: Cause-and-Effect Diagram Example: Adverse Drug Events (ADE) Drug Administration Errors Ordering Errors Physician Nurse Pharmacy Physician Nurse/Clerk Pharmacist Transcribing Rate Dilution Place outcome here Spelling Dosage Route Time Route Scheduling Nurse Order Missed Wrong Drug Dose ADE Age Unforeseen Weight Psychiatric Gender Expected Drug/Drug Renal Electrolyte Cognitive Pharmacokinetics Drug/Food Past Allergic Reaction Compliance Hepatic Drug/Lab Pharmacodyamics Absorption Race Patient Errors Physiologic Factors Pharmocologic Factors Pharmacist Patient Physician Patient Dietician This Cause-and-Effect Diagram (a.k.a. “Fishbone” or IshikawaDiagram) is very versatile: it’s also an effective tool for retrospective (Root Cause Analysis) or prospective analyses of patient safety issues (Failure Modes Effect Analysis).