Download
1 / 18
180 likes | 191 Vues
Verifying Your Trade with Volume Analysis. Presented by Thomas Hamilton Special Risk Capital Management, LLC Disclaimer:

E N D
Verifying Your Trade with Volume Analysis Presented by Thomas Hamilton Special Risk Capital Management, LLC Disclaimer: The sole purpose of this presentation is to present possibilities and educate / entertain the audience. It is NOT intended to promote any strategy, indicator, technique or software. It is the responsibility of each investor / trader to research, evaluate and test ideas before incorporating them into their own trade plan. Neither Mr. Hamilton, or Special Risk Capital Management, LLC make any implied value as to the content herein. You and you alone are responsible for due diligence.
What do You Think ? Optimist: “The Glass is Half Full” Pessimist: “The Glass is Half Empty” Engineer: “The Glass Is Twice As Big As It Needs To Be !” I am an Engineer. I am a “Quant”.
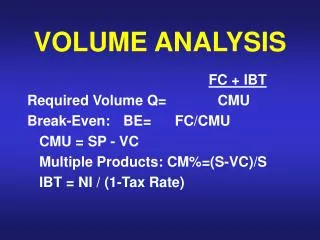
Why Study & Understand Volume ? Confirm or Verify Trades -Entry & Exit (part of the trading plan) Determine Position Size (confidence level, risk strategy) Select a Few Out of Many to Trade (narrowing the candidates, increasing your edge) Market Indicator / Market Environment (confirm market environment & trend)
What is Volume ? • Indicator of Activity. • Separate Independent Data, Not Derived from Price. • Indicator of Supply & Demand, when used with Price. - Supply = Those willing to Sell at a Price. - Demand = Those willing to Buy at a Price. • The amount of shares offered at a price, either to Buy or to Sell, is an indication of the amount of “pressure” on the price. • The objective is to detect Accumulation and Distribution of shares by “The Composite Operator”.
If - We Buy 1,000 shares at the market; we drive the price from 269.89 to 269.95. We Sell 1,000 shares at the market; We drive the price from 269.89 to 269.88. Thus - Price IS Effected by the Supply (willing Sellers) and Demand (willing Buyers). (in a perfect market)
What is Volume ? continued “ . . . Volume is to the price movement of stocks as gasoline is to the automobile. If you step on the accelerator of your car, giving the motor more gas, the car will start to travel faster. The more gas you feed it, the greater will be its momentum. Now, when your car has acquired considerable momentum, if you throw the clutch out and coast, your car will travel a considerable distance on the acquired momentum.” Analogy from The Stock Market Institute
Popular Volume Indicators • Accumulation / Distribution • Demand Index • Chaikin Money Flow • Ease of Movement • Herrick Payoff Index • Klinger Oscillator • Money Flow Index • Negative Volume Index • On Balance Volume • Positive Volume Index • Trade Volume Index • Trin / Arms Index • Volume Oscillator (MACD) • Volume Rate of Change
Other Methods – Volume at Price - Shows Up (green) & Down Bar (red) Volume at Price Level. - Indicates Type & Amount of Commitment, at that Price. - Uses: Determining Support and Resistance Levels. Source: www.freestockcharts.com; 30 min. bars shown.
Problems and Things to Consider . . . • Most effective with Supply & Demand securities (stocks). - Stocks have finite amount of supply; Float Shares. - ETF’s & Futures contracts are derivatives. Their value is derived from the underlining securities (cash) value; thus Demand Volume effects price, but Supply is not limited. • Volume may not be accurate. - Off exchange, private sales and dark pool volume may not be reported. • Volume May Not Reflect “Pure” Supply or Demand - Flash / Algorithmic Trading; short term computer driven & arbitrage cause temporary distortions.
Thoughts for Further Study • Ultra High or Low Volume, in the right background, can be an indicator of Large Composite Operators moving into or out of a security. • Bullish: volume is increasing (but not ultra high volume) on an up bar and decreasing on a down bar, in an Up trend. • Bearish: volume is increasing (but not ultra high volume) on a down bar and decreasing on an up bar, in a Down trend. • Institutions take positions over time, many days, buying or selling, trying to have minimal effect on price. • Ultra high volume often marks a significant top or bottom. • Weakness starts to appear on Up bars. i.e. Up Thrust – ultra high volume. No Demand – ultra low volume • Climatic Action: high volume on a narrow range bar (after a significant up trend) possible high level of distribution, demand = supply. Beware !
Summary Take the time to understand volume. It’s most effective when applied knowing the correct context and background. The objective is to detect Accumulation at the Bottom, as price begins to rise and Distribution at the Top, just as price begins to fall. It can be applied in all time frames, it just takes practice. It can be applied to derivative securities, though the differences are more subtle.
Resources • http://www.ord-oracle.com/Articles.aspx • http://www.tradeguider.com/bestofwyckoff/ • http://www.freestockcharts.com • “The Three Skills of Top Trading”, by Hank Pruden (Behavioral Systems Building, Pattern Recognition & Mental State Management) • “Charting the Stock Market”, edited by Jack Hutson • “How I Trade and Invest in Stocks & Bonds”, et al, by Richard Wyckoff • The importance of staying “in the now”: “The Power of Now” and “A New Earth”, by Echart Tolle
A Final Thought On The Edge of Discomfort, is Where Change Happens. Explore