Download
1 / 61
620 likes | 1.02k Vues
Fundamental Economic Concepts. Chapter 2. Fundamental Economic Concepts. Demand, Supply, and Equilibrium Review Total, Average, and Marginal Analysis Finding the Optimum Point Present Value, Discounting & Net Present Value Risk and Expected Value Probability Distributions

E N D
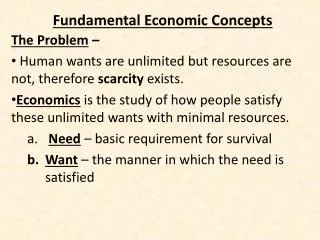
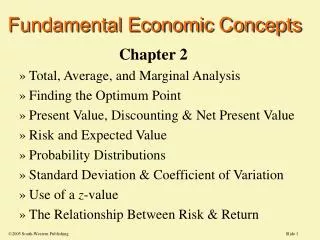
Fundamental Economic Concepts Chapter 2
Fundamental Economic Concepts • Demand, Supply, and Equilibrium Review • Total, Average, and Marginal Analysis • Finding the Optimum Point • Present Value, Discounting & Net Present Value • Risk and Expected Value • Probability Distributions • Standard Deviation & Coefficient of Variation • Normal Distributions and using the z-value • The Relationship Between Risk & Return
Law of Demand • A decrease in the price of a good, all other things held constant, will cause an increase in the quantity demanded of the good. • An increase in the price of a good, all other things held constant, will cause a decrease in the quantity demanded of the good.
Change in Quantity Demanded Price An increase in price causes a decrease in quantity demanded. P1 P0 Quantity Q1 Q0
Change in Quantity Demanded Price A decrease in price causes an increase in quantity demanded. P0 P1 Quantity Q0 Q1
Demand Curves • Individual Demand Curve the greatest quantity of a good demanded at each price the consumers are willing to buy, holding other influences constant $/Q $5 20 Q /time unit
Sam + Diane = Market • The Market Demand Curve is the horizontal sum of the individual demand curves. • The Demand Functionincludes all variables that influence the quantity demanded 4 3 7 Q = f( P, Ps, Pc,Y, N PE) - + - ? + + P is price of the good PS is the price of substitute goods PC is the price of complementary goods Y is income, N is population, PE is the expected future price
Determinants of the Quantity Demanded i. price, P ii. price of substitute goods, Ps iii. price of complementary goods, Pc iv. income, Y v. advertising, A vi. advertising by competitors, Ac vii. size of population, N, viii. expected future prices, Pe xi. adjustment time period, Ta x. taxes or subsidies, T/S • The list of variables that could likely affect the quantity demand varies for different industries and products. • The ones on the left are tend to be significant.
Change in Demand An increase in demand refers to a rightward shift in the market demand curve. Price P0 Quantity Q0 Q1
Change in Demand A decrease in demand refers to a leftward shift in the market demand curve. Price P0 Quantity Q1 Q0
Law of Supply • A decrease in the price of a good, all other things held constant, will cause a decrease in the quantity supplied of the good. • An increase in the price of a good, all other things held constant, will cause an increase in the quantity supplied of the good.
Change in Quantity Supplied A decrease in price causes a decrease in quantity supplied. Price P0 P1 Quantity Q1 Q0
Change in Quantity Supplied An increase in price causes an increase in quantity supplied. Price P1 P0 Quantity Q0 Q1
Supply Curves • Firm Supply Curve- the greatest quantity of a good supplied at each price the firm is profitably able to supply, holding other things constant. $/Q Q/time unit
Acme Inc. + Universal Ltd. = Market • The Market Supply Curve is the horizontal sum of the firm supply curves. • The Supply Function includes all variables that influence the quantity supplied 4 3 7 Q = g( P, PI, RC,T, T/S) + - - + ?
Determinants of the Supply Function i. price, P ii. input prices, PI, e.g., sheet metal iii. Price of unused substitute inputs, PUI, such as fiberglass iv. technological improvements, T v. entry or exit of other auto sellers, EE vi. Accidental supply interruptions from fires, floods, etc., F vii. Costs of regulatory compliance, RC viii. Expected future changes in price, PE ix. Adjustment time period, TA x. taxes or subsidies, T/S Note: Anything that shifts supply can be included and varies for different industries or products.
Change in Supply An increase in supply refers to a rightward shift in the market supply curve. Price P0 Quantity Q0 Q1
Change in Supply A decrease in supply refers to a leftward shift in the market supply curve. Price P0 Quantity Q1 Q0
Market Equilibrium • Market equilibrium is determined at the intersection of the market demand curve and the market supply curve. • The equilibrium price causes quantity demanded to be equal to quantity supplied.
Equilibrium:No Tendency to Change S • Superimpose demand and supply • If No Excess Demand and No Excess Supply . . . • Then no tendency to change at the equilibrium price, Pe P Willing & Able in cross- hatched Pe D Q
Dynamics of Supply and Demand • If quantity demanded is greater than quantity supplied at a price, prices tend to rise. • The larger is the difference between quantity supplied and demanded at a price, the greater is the pressure for prices to change. • When the quantity demanded and supplied at a price are equal at a price, prices have no tendency to change.
Equilibrium Price Movements • Suppose there is an increase in income this year and assume the good is a “normal” good • Does Demand or Supply Shift? • Suppose wages rose, what then? P S P1 e1 D Q
Comparative Statics& the supply-demand model • Suppose that demand Shifts to D’ later this fall… • We expect prices to rise • We expect quantity to rise as well P S e2 D’ e1 D Q
D1 P1 Q1 Market Equilibrium Price D0 S0 An increase in demand will cause the market equilibrium price and quantity to increase. P0 Quantity Q0
D1 P0 P1 Q1 Q0 Market Equilibrium Price D0 S0 A decrease in demand will cause the market equilibrium price and quantity to decrease. Quantity
S0 S1 P1 Q1 Market Equilibrium Price An increase in supply will cause the market equilibrium price to decrease and quantity to increase. D0 P0 Quantity Q0
S1 S0 P1 P0 Q1 Q0 Market Equilibrium Price A decrease in supply will cause the market equilibrium price to increase and quantity to decrease. D0 Quantity
Break Decisions Into Smaller Units: How Much to Produce ? • Graph of output and profit • Possible Rule: • Expand output until profits turn down • But problem of local maxima vs. global maximum profit GLOBAL MAX MAX A quantity B
Average Profit = Profit / Q • Slope of ray from the origin • Rise / Run • Profit / Q = average profit • Maximizing average profit doesn’t maximize total profit PROFITS MAX C B profits quantity Q
Marginal Profits = /Q • Q1 is breakeven (zero profit) • maximum marginal profits occur at the inflection point (Q2) • Max average profit at Q3 • Max total profit at Q4 where marginal profit is zero • So the best place to produce is where marginal profits = 0.
Present Value • Present value recognizes that a dollar received in the future is worth less than a dollar in hand today. • To compare monies in the future with today, the future dollars must be discounted by a present value interest factor, PVIF=1/(1+i), where i is the interest compensation for postponing receiving cash one period. • For dollars received in n periods, the discount factor is PVIFn =[1/(1+i)]n
Net Present Value (NPV) • Most business decisions are long term • capital budgeting, product assortment, etc. • Objective: Maximize the present value of profits • NPV = PV of future returns - Initial Outlay • NPV = t=0 NCFt / ( 1 + rt )t • where NCFt is the net cash flow in period t • NPV Rule: Do all projects that have positive net present values. By doing this, the manager maximizes shareholder wealth. • Good projects tend to have: • high expected future net cash flows • low initial outlays • low rates of discount
Sources of Positive NPVs • Brand preferences for established brands • Ownership control over distribution • Patent control over products or techniques • Exclusive ownership over natural resources • Inability of new firms to acquire factors of production • Superior access to financial resources • Economies of large scale or size from either: • Capital intensive processes, or • High start up costs
Appendix 2ADifferential Calculus Techniques in Management • A function with one decision variable, X, can be written as Y = f(X) • The marginal value of Y, with a small increase of X, is My = DY/DX • For a very small change in X, the derivative is written: dY/dX = limit DY/DX DX B
Marginal = Slope = Derivative • The slope of line C-D is DY/DX • The marginal at point C is My is DY/DX • The slope at point C is the rise (DY) over the run (DX) • The derivative at point C is also this slope D Y DY DX C X
__ _______ ___ __ ___ __ ___ ______ • Finding the maximum flying range for the Stealth Bomber is an optimization problem. • Calculus teaches that when the first derivative is zero, the solution is at an optimum. • The original Stealth Bomber study showed that a controversial flying V-wing design optimized the bomber's range, but the original researchers failed to find that their solution in fact minimized the range. • It is critical that managers make decision that maximize, not minimize, profit potential!
Quick Differentiation Review • Constant Y = c dY/dX = 0 Y = 5 Functions dY/dX = 0 • A Line Y = c•X dY/dX = c Y = 5•X dY/dX = 5 • Power Y = cXb dY/dX = b•c•X b-1 Y = 5•X2 Functions dY/dX = 10•X Name Function Derivative Example
Quick Differentiation Review • Sum of Y = G(X) + H(X) dY/dX = dG/dX + dH/dX Functions example Y = 5•X + 5•X2 dY/dX = 5 + 10•X • Product of Y = G(X)•H(X) Two FunctionsdY/dX = (dG/dX)H + (dH/dX)G exampleY = (5•X)(5•X2 ) dY/dX = 5(5•X2 ) + (10•X)(5•X) = 75•X2
Quick Differentiation Review • Quotient of Two Y = G(X) / H(X) Functions dY/dX = (dG/dX)•H - (dH/dX)•G H2 Y = (5•X) / (5•X2) dY/dX = 5(5•X2) -(10•X)(5•X) (5•X2)2 = -25X2 / 25•X4 = - X-2 • Chain Rule Y = G [ H(X) ] dY/dX = (dG/dH)•(dH/dX) Y = (5 + 5•X)2 dY/dX = 2(5 + 5•X)1(5) = 50 + 50•X
Applications of Calculus in Managerial Economics • maximization problem: A profit function might look like an arch, rising to a peak and then declining at even larger outputs. A firm might sell huge amounts at very low prices, but discover that profits are low or negative. • At the maximum, the slope of the profit function is zero. The first order condition for a maximum is that the derivative at that point is zero. • If = 50·Q - Q2, then d/dQ = 50 - 2·Q, using the rules of differentiation. • Hence, Q = 25 will maximize profits where 50 - 2•Q = 0.
More Applications of Calculus • minimization problem: Cost minimization supposes that there is a least cost point to produce. An average cost curve might have a U-shape. At the least cost point, the slope of the cost function is zero. • The first order condition for a minimum is that the derivative at that point is zero. • If C = 5·Q2 - 60·Q, then dC/dQ = 10·Q - 60. • Hence, Q = 6 will minimize cost where 10•Q - 60 = 0.
More Examples • Competitive Firm: Maximize Profits • where = TR - TC = P•Q - TC(Q) • Use our first order condition: d/dQ = P - dTC/dQ = 0. • Decision Rule: P = MC. TC a function of Q Problem 1Problem 2 • Max = 100•Q - Q2 • 100 -2•Q = 0 implies Q = 50 and = 2,500 • Max= 50 + 5•X2 • So, 10•X = 0 implies Q = 0 and= 50
Second Derivatives and the Second Order Condition:One Variable • If the second derivative is negative, then it’s a maximum • If the second derivative is positive, then it’s a minimum • Max= 50 + 5•X2 • 10•X = 0 • second derivative is: 10 implies Q = 0 is a MIN Problem 1 Problem 2 • Max = 100•Q - Q2 • 100 -2•Q = 0 • second derivative is: -2 implies Q =50 is a MAX
Partial Differentiation • Economic relationships usually involve several independent variables. • A partial derivative is like a controlled experiment -- it holds the “other” variables constant • Suppose price is increased, holding the disposable income of the economy constant as in Q = f (P, I ), then Q/P holds income constant.
Example • Sales are a function of advertising in newspapers and magazines ( X, Y) • Max S = 200X + 100Y -10X2 -20Y2 +20XY • Differentiate with respect to X and Y and set equal to zero. S/X = 200 - 20X + 20Y= 0 S/Y = 100 - 40Y + 20X = 0 • solve for X & Y and Sales
Solution: 2 equations & 2 unknowns • 200 - 20X + 20Y= 0 • 100 - 40Y + 20X = 0 • Adding them, the -20X and +20X cancel, so we get 300 - 20Y = 0, or Y =15 • Plug into one of them: 200 - 20X + 300 = 0, hence X = 25 • To find Sales, plug into equation: S = 200X + 100Y -10X2 -20Y2 +20XY = 3,250