Download
1 / 30
300 likes | 398 Vues
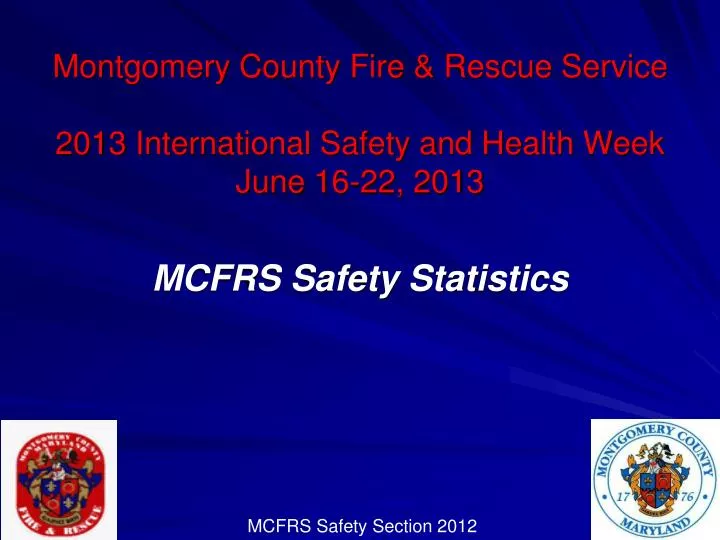
Montgomery County Fire & Rescue Service 2013 International Safety and Health Week June 16-22, 2013. MCFRS Safety Statistics. MCFRS Safety Section 2012. 2013 Safety and Health Week.

E N D
Montgomery County Fire & Rescue Service2013 International Safety and Health WeekJune 16-22, 2013 MCFRS Safety Statistics MCFRS Safety Section 2012
2013 Safety and Health Week This presentation will focus on the National Line of Duty Deaths over the last 10 years, the causes and incident types for the deaths from 2006 to 2012, the Estimated National Firefighter Injury Statistics and present the MCFRS collision and injury statistics for the years of 2007 – 2013. MCFRS Safety Section
2013 Safety and Health Week National LODD Statistics • 2003 - 110 deaths • 2004 - 102 deaths is a 7% decrease • 2005 - 107 deaths is a 5% increase • 2006 - 87 deaths is a 19% decrease • 2007 - 114 deaths is a 31% increase • 2008 - 120 deaths is a 5% increase • 2009 - 93 deaths is a 22% decrease • 2010 – 87 deaths is a 8.6% decrease • 2011 – 81 deaths is a 7% decrease • 2012 – 83 deaths is a 2.4% increase MCFRS Safety Section
2006 Deaths by Cause Cardiovascular Trauma Smoke Inhalation Burns Undetermined Drowning 2006 Deaths by Type Structure Fire Wild land Fire Training MVA EMS Call 2013 Safety and Health WeekNational LODD Statistics MCFRS Safety Section
2007 Deaths by Cause Cardiovascular Trauma Smoke Inhalation Burns Electrocution 2007 Deaths by Type Structure Fire Training Multiple Calls w/in 24 hrs MVA EMS Calls 2013 Safety and Health WeekNational LODD Statistics MCFRS Safety Section
2008 Deaths by Cause Cardiovascular Trauma Burns/Smoke Inhalation Asphyxiation Violence/Gunshot Electrocution 2008 Deaths by Type Structure Fire Wild land Fire MVA Non-Emergency Duty Training EMS Call 2013 Safety and Health WeekNational LODD Statistics MCFRS Safety Section
2009 Deaths by Cause Stress/Overexertion Vehicle Collisions Fall Struck by Caught/Trapped Other 2009 Deaths by Type Not Incident Related Structure Fire Wildland MVA EMS Other 2012 Safety and Health WeekNational LODD Statistics MCFRS Safety Section
2010 Deaths by Cause Stress/Overexertion Vehicle Collision Struck by Other Caught/Trapped Fall Collapse 2010 Deaths by Type Not Incident Related Structure Fire Wildland Other MVA Rescue/Extrication Unknown EMS Tech Rescue 2013 Safety and Health WeekNational LODD Statistics MCFRS Safety Section
2011 Deaths by Cause Cardiovascular Trauma Burns Drowning Smoke Inhalation Other 2011 Deaths by Type Structure Fire Wildland Training Multiple Calls EMS MVA Other Emergency 2013 Safety and Health Week National LODD Statistics MCFRS Safety Section
2012 Deaths by Cause Cardiovascular Trauma Smoke Inhalation Asphyxiation Drowning Other-Hyperthermia 2012 Deaths by Type Structure Fire Training MVA Wild land Brush/Grass Fire Natural Disaster EMS 2013 Safety and Health Week MCFRS Safety Section
2013 Deaths by Cause 2013 Deaths by Type 2013 Safety and Health Week 37 LODD’s as of 6/1/2013 MCFRS Safety Section
2005 – 80,100 estimated US Firefighter injuries 2006 – 83,400 estimated US Firefighter injuries 2007 - 80,100 estimated US Firefighter injuries 2008 – 79,700 estimated US Firefighter injuries 2009 – 78,150 estimated US Firefighter injuries 2010 – 71,875 estimated US Firefighter injuries 2011 – 70,090 estimated US Firefighter injuries 2013 Safety and Health WeekNational Injury Statistics MCFRS Safety Section
2013 Safety and Health WeekMCFRS Collision Statistics MCFRS Safety Section
2013 Safety and Health Week MCFRS Collision Statistics • 1999 – 110 collisions • 2000 – 140 collisions 27% increase • 2001 – 160 collisions 14% increase • 2002 – 129 collisions 19% decrease • 2003 – 140 collisions 8% increase • 2004 – 117 collisions 16% decrease • 2005 – 129 collisions 10% increase • 2006 – 133 collisions 3% increase MCFRS Safety Section
Collisions By Battalion Battalion 1 – 40 Battalion 2 – 34 Battalion 3 – 57 Battalion 4 – 29 Battalion 5 – 28 Battalion 99 – 20 Collisions by Cause Clearance Backing Weather Other at Fault Animal Strike Incident AM Check-out 2013 Safety and Health Week2007 Collisions– 208 Total 56% Increase MCFRS Safety Section
Collisions By Battalion Battalion 1 – 45 Battalion 2 – 26 Battalion 3 – 59 Battalion 4 – 48 Battalion 5 – 23 Battalion 99 – 26 Collisions by Cause Clearance Backing Driver Error Other at Fault Incident Animal Strike AM Check-out Situational Awareness 2013 Safety and Health Week2008 Collisions– 227 Total 8 % Increase MCFRS Safety Section
Collisions By Battalion Battalion 1 – 69 Battalion 2 – 24 Battalion 3 – 66 Battalion 4 – 42 Battalion 5 – 20 Battalion 99 – 16 Collisions by Cause Clearance Backing Other at Fault AM Check-out Intersection Mechanical/Equipment Animal Strike Situational Awareness 2013 Safety and Health Week2009 Collisions– 240 Total 5% increase MCFRS Safety Section
Collisions By Battalion Battalion 1 – 50 Battalion 2 – 29 Battalion 3 – 66 Battalion 4 – 64 Battalion 5 – 31 Battalion 99 – 16 Collisions by Cause Clearance Backing Other at Fault AM Check-out Intersection Mechanical/Equipment Animal Strike Situational Awareness 2013 Safety and Health Week2010 Collisions– 256 Total 7.5% Increase MCFRS Safety Section
Collisions By Battalion Battalion 1 – 34 Battalion 2 – 42 Battalion 3 – 53 Battalion 4 – 43 Battalion 5 – 33 Out of County – 5 Collisions by Cause Clearance Backing Other at Fault AM Check-out Intersection Mechanical/Equipment Animal Strike Situational Awareness 2013 Safety and Health Week2011 Collisions– 210 Total 17.9% decrease MCFRS Safety Section
Collisions By Battalion Battalion 1 – 26 Battalion 2 – 48 Battalion 3 – 53 Battalion 4 – 52 Battalion 5 – 30 Out of County – 3 Collisions by Cause Clearance Backing Other at Fault AM Check-out Intersection Mechanical/Equipment Animal Strike Situational Awareness 2013 Safety and Health Week2012 Collisions– 212, .952% increase MCFRS Safety Section
Collisions By Battalion Battalion 1 – 16 Battalion 2 – 12 Battalion 3 – 17 Battalion 4 – 20 Battalion 5 – 11 Out of County – 31 Collisions by Cause Clearance Backing Other at Fault AM Check-out Intersection Mechanical/Equipment Animal Strike Situational Awareness 2013 Safety and Health Week2013 Collisions– 73 as of 6/1/2013 MCFRS Safety Section
2013 Safety and Health WeekMCFRS Injury Statistics • 2002 – 526 Injuries • 2003 – 637 Injuries 21% increase • 2004 – 579 Injuries 9% decrease • 2005 – 482 Injuries 17% decrease • 2006 – 501 Injuries 4% increase MCFRS Safety Section
Nature of Injury Sprain/Strain Bruise/Contusion Cut/Scratch/Laceration Other Contagious/Infectious Fracture Thermal burn Foreign Object Cardiac related Injuries by Task EMS Incidents Firefighting Incidents Physical Fitness Activity Training Activity Service Activities (other) Maintenance Bldg/Equip Other Moving to/from on foot Responding to incident 2013 Safety and Health Week2007 Injuries– 582 Total 16% increase MCFRS Safety Section
Nature of Injury Sprain/Strain Contagious/Infectious Bruise/Contusion Cut/Scratch/Laceration Cardiac related Irritation Foreign substance Thermal burn Other Injuries by Task EMS Incidents Firefighting Incidents Training Activity Physical Fitness Activity Service Activity (other) Maintenance Bldg/Equip Moving to/from on foot Responding to incident Other 2013 Safety and Health Week2008 Injuries– 659 Total 13% increase MCFRS Safety Section
Nature of Injury Sprain/Strain Bruise/Contusion Cut/Scratch/Laceration Contagious/Infectious Cardiac related Foreign Substance Other Thermal burn Inflammation Injuries by Task EMS Incidents Firefighting Incidents Physical Fitness Activity Training Activity Maintenance Bldg/Equip Moving to/from on foot Service Activity (other) Other Responding to incident 2013 Safety and Health Week2009 Injuries– 587 total 10% decrease MCFRS Safety Section
Nature of Injury Sprain/Strain Bruise/Contusion Cut/Scratch/Laceration Foreign Substance Other Cardiac related Contagious/Infectious Irritation Fracture Injuries by Cause Firefighting Incidents EMS Incidents Physical Fitness Activity Maintenance Bldg/Equip Moving to/from on foot Training Activity Service Activity (other) Other Responding to incident 2013 Safety and Health Week2010 Injuries– 605 total 3% increase MCFRS Safety Section
Nature of Injury Sprain/Strain Bruise/Contusion Cut/Scratch/Laceration Foreign Substance Other Cardiac related Contagious/Infectious Irritation Fracture Injuries by Cause EMS Incidents Firefighting Incidents Physical Fitness Activity Maintenance Bldg/Equip Moving to/from on foot Training Activity Service Activity (other) Other Responding to incident 2013 Safety and Health Week2011 Injuries– 563 total 6.9% decrease MCFRS Safety Section
Nature of Injury Sprain/Strain Bruise/Contusion Cut/Scratch/Laceration Foreign Substance Other Cardiac related Contagious/Infectious Irritation Fracture Injuries by Cause EMS Incidents Firefighting Incidents Physical Fitness Activity Maintenance Bldg/Equip Moving to/from on foot Training Activity Service Activity (other) Other Responding to incident 2013 Safety and Health Week2012 Injuries– 570 injuries .175% increase MCFRS Safety Section
Nature of Injury Sprain/Strain Bruise/Contusion Cut/Scratch/Laceration Foreign Substance Other Cardiac related Contagious/Infectious Irritation Fracture Injuries by Cause EMS Incidents Firefighting Incidents Physical Fitness Activity Maintenance Bldg/Equip Moving to/from on foot Training Activity Service Activity (other) Other Responding to incident 2013 Safety and Health Week2013 Injuries– 248 injuries as of 6/1/2013 MCFRS Safety Section
2013 Safety and Health Week Collisions and injury prevention is everyone's concern! Since 2002 MCFRS has sustained 6539 injuries and 2074 collisions! What can you do to prevent them from occurring? MCFRS Safety Section