Download
1 / 28
290 likes | 478 Vues
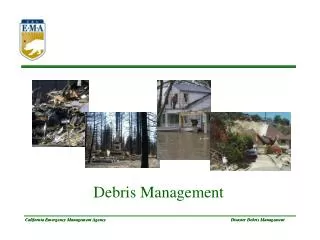
Non-structural Measures for Flash Flood and Debris Flow Disaster Prevention. Sun Dongya. Research Center on Flood and Drought Disaster Reduction (RCDR), MWR China Institute of Water Resources and Hydropower Research (IWHR). Debris-flow disaster, Zhouqu city of Hansu Province.

E N D
Non-structural Measures for Flash Flood and Debris Flow Disaster Prevention Sun Dongya Research Center on Flood and Drought Disaster Reduction (RCDR), MWR China Institute of Water Resources and Hydropower Research (IWHR)
Slope failure in Wulongconty of Chongqing City • Slope failure in Touzhaigou valley of Yunnan Province
In 2002, China initiated nation-wide comprehensive project on flash flood and debris flow disaster prevention. The Ministry of Water Resources, the Ministry of Land Resources, China Meteorological Administration, The Ministry of Construction, the Ministry of Environmental Protection work together to carry out National Planning on Flash Flood and Debris Flow Disaster Prevention
According to the planning, 1836 counties in 29 provinces (cities), has the tasks for flash flood and debris flow disaster prevention. The areas of these regions amount to 4.65 million km3 And there are 0.56 billion residents living in these area. Nation-wide flash flood and debris flow risk map are worked in 2006.
Knowledge generalization and training Non-structural Measures Monitoring, communication and warning system Preparatory schemes, methodology for disaster prevention and exercises Resettlement Policies and regulations Management
Treatment of flash flood Valley Structural Measures Treatment of debris flow valley Landslide treatment Rehabilitation of dams with deficiencies Soil and water conservation
Total investment: 187 billion Yuan (30 billion US$); Non-structural measures: 53.9 billion Yuan. Non-structural Measures
Monitoring system • Automatic rainfall gage • grid dimension:10-20km; 20-40km • Simple rainfall gage for home usage • Water level • Hydrological stations • Movable hydrological stations
Pilot projects in 103 counties including 1413 towns and villages have been accomplished and gotten great achievements
Houcun village in Lichuan county, Jiangxi province Severe debris flow No life lose (benefits from non-structural measures)
Rainfall monitoring data of provincial level Meteorological Rainfall and flood data Meteorological Rainfall and flood data Headquarter of provincial level County level Warning based on person-person model Warning system platform Rainfall monitoring data from local sites Heavy rainfall emergency flood town WG Family village Reservoir /pool
GPRS Short message server Intranet of mobile phone GSM GGSN DDN Internet GREtunnel GSM terminals GPRS/GSM Terminals receiver RTU Data collection terminals server Monitoring station Data processing Central Receiving station Communication system based on GPRS
Solar energy board Communication terminals Charge controller Rainfallgage Terminals for remote monitoring Electricity Storage
Routine observation Debris flow Cracks Displacement Rainfall gage
Water level monitoring Warning board for potential disaster
A sample of the flood inundation depth map The flood inundation depth is divided into 5 grades with different colors. Some additional data such as rainfall data, legends, and scale etc. Figure 2: Flood Hazard Map