Download
1 / 25
250 likes | 784 Vues
pH titration curves. pH measured as an acid is neutralized by a base follows a characteristic curve that enables the equivalence-point to be determined with precision. Constructing curves. Shapes of curves will depend on the strength of the acid and base

E N D
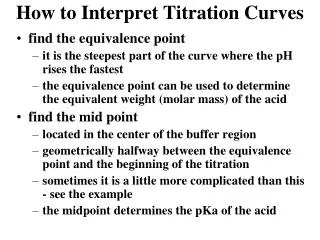
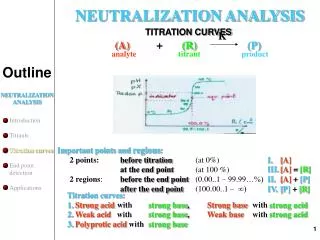
pH titration curves • pH measured as an acid is neutralized by a base follows a characteristic curve that enables the equivalence-point to be determined with precision
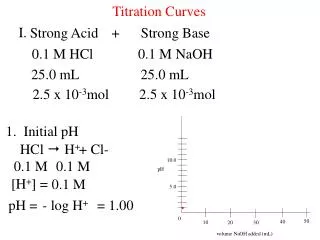
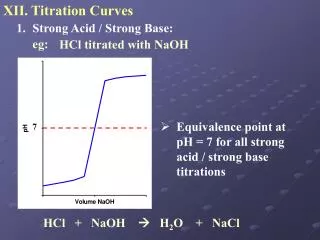
Constructing curves • Shapes of curves will depend on the strength of the acid and base • Construct curve by calculating [H3O+] as the base (acid) is added. • The strong-strong case is easy: all species are always completely ionized. At the equivalence point, pH = 7 • Weak acid - strong base will use pKa for the acid
Titration of weak acid with strong base in four zones • Zone 1: Initial pH of acid with no base added • Zone 2: Addition of OH- up to equivalence point • Zone 3: At equivalence point: all the HAc is converted into Ac- • Zone 4: After equivalence point
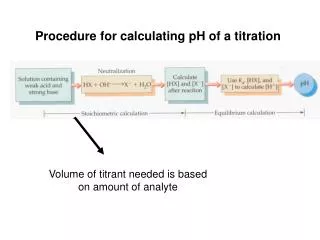
Constructing a pH curve for the weak acid - strong base case • Zone 1: Initial pH of acid with no base added • Zone 2: Addition of OH- up to equivalence point • Treat like a buffer solution • NOTE: Concentrations change as volume increases with addition of base!
Explicit (contains adult themes) calculation for zone 2 • Determination of [H+] up to equivalence point • [HAc]o is initial concentration of HAc and VH is the initial volume of HAc used • [OH-] is initial concentration of the base and VOH is the volume added at that point in the titration
Weak acid – strong base continued • Zone 3: At equivalence point: all the HAc is converted into Ac- • Treat like solution of basic salt • Where [Ac-] is the initial acetate concentration at the neutralization point prior to dissociation
Weak acid – strong base continued • Zone 4: After equivalence point • All OH- results from the excess base
pH curves assist in identifying suitable indicator • The equivalence point with the weak acid is at pH>7 • Above pH 7, both curves coincide (strong base controls pH) • The initial rise in pH is greater with the weak acid (but at much lower [H3O+]
End-point detection gets harder with weaker acids • Initial pH is higher • Initial change in pH is greater • Change in pH at equivalence point is lower • Harder to detect equivalence point in weak acid
Weak base - strong acid • Analogous to the weak acid – strong base case • pH at equivalence point < 7 • Dictates use of different indicator • pH after equivalence point controlled by strong acid
Polyprotic acids – lots to note • An amino acid has two dissociations: H2A+ + H2O = HA + H3O+ HA + H2O = A- + H3O+
Example for alanine • Initially, pH determined by pKa1 • Halfway to 1st equivalence pt pH = pKa1 • 1st equivalence pt, • Halfway to 2nd equivalence pt, pH = pKa2 • 2nd equivalence pt, pH determined by pKb for the base A- (Kb obtained from Ka2) • Beyond 2nd equivalence pt, pH determined from OH- from NaOH
Solubility products – equilibrium between solute and solid • An electrolyte completely dissociated in equilibrium with undissolved solid • The solid phase is ignored • Writing Ksp expressions for salts
Calculations • Determine Ksp from solution concentrations (concentrations of individual ions may not be equal to those you would get by simple dissociation of compound) • Determine solubility from Ksp MgF2 = Mg2+ + 2F- Ksp = x.(2x)2 x =[Mg2+]
Factors affecting solubility • Common ion effect – the addition of an ion from another source • Solution pH – where there is a weak acid or base • Complex ion formation • Amphotericity
Common ion effect • In a solution of a salt AB, addition of a additional B ions from another source will cause [A] to decrease because of Ksp
Calculation of solubility under these conditions • Calculate solubility of MgF2 in a solution of 0.1 M NaF(aq)? • At equilibrium, [Mg2+] = x, [F-] = 0.1 + 2x
Solution pH • Basic anions are protonated in acid • CaCO3 is insoluble in pure water • In acid solution, H+ converts CO32- to HCO3- • More Ca2+ is drawn into solution (Le Chatelier) • Salts of basic anions increase solubility in acid conditions • pH does not affect anions that are not basic
Complex ion formation affects solubility • AgCl is ordinarily highly insoluble (test for chloride ions) • Addition of aqueous ammonia redissolves the precipitate by formation of the complex ion Ag(NH3)2+
Two stage process of formation of highly favoured complex • Equilibrium lies to right
Amphoteric substances • Dissolve in both acid and basic solutions • Examples of complex ion formation • Oxides and hydroxide of Al are examples
Prediction of precipitation and ion products • Predict the formation of a precipitate when solutions are mixed • Ion product is not an equilibrium quantity IP = [Ca2+][F-]2 • If IP is found to be larger than Ksp then precipitation occurs
Selective precipitation • Mixtures of ions can be separated by combining with an anion that has wide range of solubiity. • For example, sulphides of Zn, Pb, Cu and Hg will precipitate leaving the sulphides of Mn, Fe, Co and Ni in solution • Ksp for former group are much larger than for latter group
Qualitative analysis • Apply a sequence of precipitation steps to divide a group of many metal ions into smaller groups. These smaller groups will be further analyzed to identify the members therein