Download
1 / 25
250 likes | 378 Vues
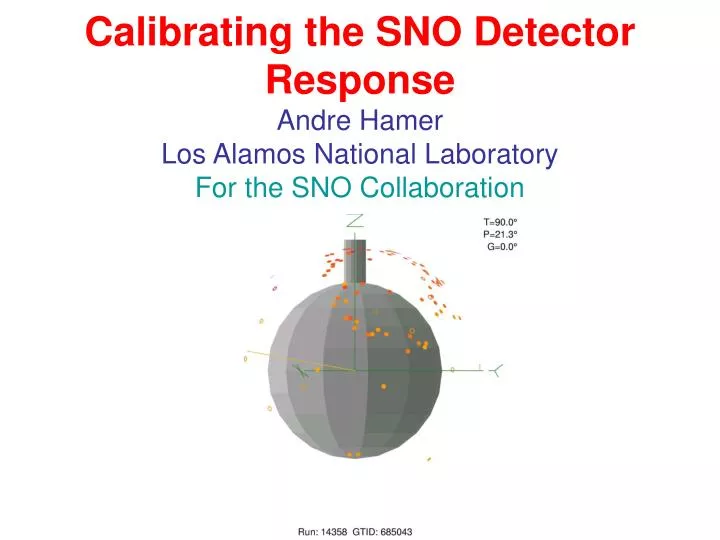
Calibrating the SNO Detector Response Andre Hamer Los Alamos National Laboratory For the SNO Collaboration. Outline. The SNO Experiment Calibrating SNO The Calibration Devices Detector Response Studies Solar Neutrino Fluxes Measured by SNO + Systematic Uncertainties.

E N D
CalibratingtheSNODetectorResponseAndre HamerLos Alamos National LaboratoryFor the SNO Collaboration
Outline • The SNO Experiment • Calibrating SNO • The Calibration Devices • Detector Response Studies • Solar Neutrino Fluxes Measured by SNO + Systematic Uncertainties
Solar Neutrinos Figure by J. Bahcall TheSolarNeutrinoProblem Experimental Results SAGE+GALLEX/GNO Flux = 0.58 SSM Homestake Flux = 0.33 SSM Kamiokande + Superkamiokande Flux = 0.46 SSM Do Neutrinos Oscillate ?
TheSNODetector Nucl. Inst. and Meth. A449, p172 (2000)
Neutral-Current (NC) nx + d nx+ n + p nx + e-nx + e- Elastic Scattering (ES) NeutrinoDetectioninSNO Charged-Current (CC) neOnly BetterSpectralSensitivity Weakdirectionalsensitivity1-1/3cos(q) ne + d e- + p + p nxEqual Sensitivity to all flavours nxEnhanced Sensitivity for ne Strong DirectionalSensitivity Lower Statistics
ne CC = ne+ 0.154(nm+nt) ES ne CC = (ne+nm+nt) NC The Solar Neutrino Program Test for Flavour Change Measure Total 8B Flux Temporal Dependences Spectral Distortions Hep Flux
ThisTalk TheExperimentalPhases I. Pure D2O II. D2O+NaClAdditive III. D2O + NCDs (3He proportional counters) CC & ES (EThreshold=6.75 MeV) Add NC (Lower EThreshold) Enhanced NC Sensitivity NC/CC separation by event isotropy Event by event separation Improved Spectral Sensitivity n d t g … e (Eg = 6.25 MeV) n35Cl 36Cl g … e (Eg = 8.6 MeV) n3He p t
CalibrationinSNO Primary Calibrations • Electronics and PMT • Optics Constants • Energy Scale and Stability Verification of Response • Energy Response • Reconstruction Response • Neutron Capture Response Characterizing Backgrounds • Data Reduction • High/Low Energy Background Estimates
SourceDeploymentandManipulation Umbilicals Manipulation Detector Interface Radon/Light Barrier Accuracy < 2 cm single axis ~ 5 cm triple axis Remote Operation/Interlocks Stringent Cleanliness Requirements
Wavelengths 337 nm, 365 nm, 386 nm, 420 nm, 500 nm, 620 nm Dye Laser System 100’ Fibre Optic Pulse Rate Up to 45 Hz Pulse Width 600 ps Adjustable Intensity Neutral-Density Filters Diffuser Ball TheOpticalSource
Nitrogen-16 Nearly Mono-energetic 6.13 MeV (66.2 %), 7.12 MeV (4.8 %) Half-Life:7.13 sec. Tagged by Beta Nucl-ex/0109011 Lithium-8 Beta Spectrum Central Endpoint Value (12.98 MeV) Half-Life:0.838 sec. Tagged by Alpha Nucl-ex/0202024 TheShortLivedRadioisotopeSources
RadioisotopeProduction DT Generator Two Target Chambers 16O(n,p)16N 11B(n,a)8Li MF Physics A320P 10^8 n/s
RadioisotopeTransport Transfer Length Capillaries Transport Streams Flow Rates Head Pressures ~220 feet 1/8” Teflon CO2 (16N) He+NaCl (8Li) 260 Atm-cc/sec ~95 psiA (16N) ~35 psiA(8Li)
The16NChamber BlocksBetas Tagging Efficiency > 90 % Decay Rate 1-300 Hz Tunable via DT target position, DT n-output, Gas Flow
The8LiChamber Good Alpha Discrimination Alpha Scintillation in Helium ~0.1 % N2 as wavelength shifter Tagging Efficiency > 90 % Decay Rate ~0.5 Hz
ThepTSource Compact ion source/accelerator DC proton beam (<30 keV) High Purity ScT2 target (4 Ci T2) Lifetime: 100 hours 3H(p,g)4He reaction 19.8 MeV g • rate: ~0.5 Hz neutron rate: < 1kHz Nucl. Instr. and Meth. A452, p 115 (2000). TheEncapsulatedSources Radioisotopes encased in acrylic 252Cf 232U (Thorium Chain) 226Ra(Uranium Chain) neutrons 2.6 MeV g 2.4 MeV g
OpticalAnalysis D2O Attenuation H2O Attenuation PMTcalibrations, PMTangularresponse, lD20, lacrylic,lH2O
EnergyScale with 16N Cherenkov Timing All PMT Hits Tune PMT Efficiency in Monte Carlo Prompt Hits Optical Response Cos Theta R Event Radius
Energy Response Checks VerifyEnergyResponse with 16N, 252Cf, 8Li, pT • Temporal Stability • Position Dependence • Energy Dependence • Resolution Time Energy Position Energy Scale Uncertainty: 1.4 %
ReconstructionResponse Vertex from 16N and 8Li Angular Resolution N16 Important for ES Extraction Bias Li8 N16 Resolution Resolution: 16 cm vertex, 26.70 angular @ 5 MeV
Testing Cuts Low Level Cuts High Level Cuts Fractional Signal Loss Mean angle between PMT hits Number of Hits Fraction of prompt hits
High Energy g Contamination 16N n Data
High Threshold D2O Analysis Simulated Response Evidence: neutrino oscillations CC NC ES Energy or Nhit X 106 cm-2s-1 Fmt Radius Cubed Direction from Sun Fe Phys. Rev. Lett. 87 (2001) 071301
SystematicErrors:HighThresholdAnalysis Error Source Energy Scale Energy Resolution Energy Non-Linearity Vertex Accuracy Vertex Resolution Angular Resolution High Energy g‘s Low Energy Bkg. Instrumental Bkg. Cut Acceptance Trigger Efficiency Livetime Experimental Total CC Error (%) -5.2,+6.1 +/-0.5 +/-0.5 +/-3.1 +/-0.7 +/-0.5 -0.8,+0.0 -0.2,+0.0 -0.2,+0.0 -0.6,+0.7 0.0 +/-0.1 -6.2,+7.0 ES Error (%) -3.5,+5.4 +/-0.3 +/-0.4 +/-3.3 +/-0.4 +/-2.2 -1.9,+0.0 -0.2,+0.0 -0.6,+0.0 -0.6,+0.7 0.0 +/-0.1 -5.7,+6.8 Calibrations used with MC 16N 16N, pT 16N, 8Li, pT 16N, 8Li 16N, 8Li 16N 16N U/Th 16N, 8Li 16N, 8Li
Conclusions SNO has developed unique devices and methods for calibrating its detector response, establishing systematic uncertainties, and understanding backgrounds. We have presented SNO’s initial high threshold D2O analysis. Outlook Ongoing analysis is focused on lowering the analysis threshold for the pure D2O Phase and calibrating the Salt Phase of the Experiment. This necessitates a greater emphasis on neutron response and low energy backgrounds studies. Low threshold analysis progressing well.