Download
1 / 42
420 likes | 724 Vues
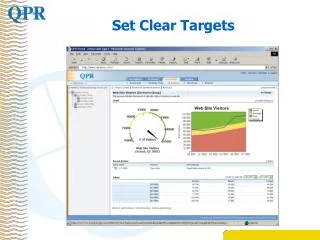
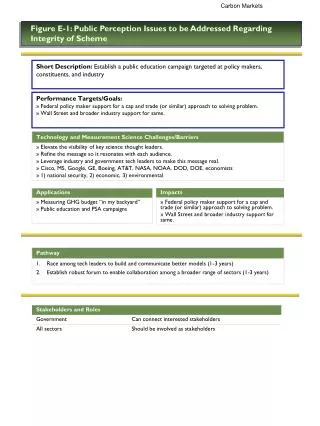
How to Set Performance Targets in Inventory Control. Dr. Everette S. Gardner, Jr. How to Set Performance Targets in Inventory Control. Clean up the parts list Develop a basic forecasting system Use the forecasts to classify parts (ABC+) Decide what to stock Decide where to stock it

E N D
How to Set Performance Targetsin Inventory Control Dr. Everette S. Gardner, Jr.
How to Set Performance Targets in Inventory Control • Clean up the parts list • Develop a basic forecasting system • Use the forecasts to classify parts (ABC+) • Decide what to stock • Decide where to stock it • Divide the inventory into control groups: • JIT, MRP, EOQ, Annual buy • Develop benchmark performance measures
Clean Up the Parts List Code substitute items Ensure historical demand recorded against primary items Delete obsolete items (no longer used in current product line) Do the part numbers apply to other customers or products? Review items with no recent demand Stocking rules usually depend on demand in the last 6 months or the last year Negotiate with vendors to return parts for credit
Water Filtration Company: Status of 23,192 inventory items
The Importance of Forecasting Forecasts determine production and inventory quantities MRP: Master schedule EOQ: Order quantity, leadtime demand, safety stock JIT: Requirements to internal and external suppliers
The Importance of Forecasting (cont.) Better forecast accuracy cuts inventory investment. Example: Forecast accuracy is measured by the standard deviation of the forecast error. Safety stocks are usually set at 3 times the standard deviation If the standard deviation is cut by $1, safety stocks are cut by $3
Forecasting Tools for Inventory Control Simple exponential smoothing Weighted-moving-average technique for stable items Highly recommended for repair parts demand Trend-adjusted exponential smoothing Estimates and projects growth (or decline) in demand Types of growth Exponential Linear Damped Both models are easily modified to handle seasonal demands
Origins of the Damped Trend Reference Gardner & McKenzie, Management Science, 1985 Operational requirement Automatic forecasting system for military repair and maintenance parts Theory Lewandowski, IJF, 1982 (M1-Competition) Trend extrapolation should become more conservative as the forecast horizon increases.
The Damped Trend Error= Actual demand – Forecast Level= Forecast + Weight1(Error) Trend = (Previous trend) + Weight2(Error) Forecast for t+1= Level + Trend Forecast for t+2 = Level + Trend + 2 Trend . .
Automatic Forecasting with the Damped Trend Constant-level data Forecasts emulate simple smoothing Consistent trend Forecasts emulate Holt’s linear trend Erratic trend Forecasts are damped
Automatic Forecasting with the Damped Trend In constant-level data, the forecasts emulate simple exponential smoothing:
Automatic Forecasting with the Damped Trend In data with a consistent trend and little noise, the forecasts emulate Holt’s linear trend:
Automatic Forecasting with the Damped Trend When the trend is erratic, the forecasts are damped:
Automatic Forecasting with the Damped Trend The damping effect increases with the level of noise in the data:
11-Oz. Corn chipsMonthly Inventory and Sales Actual Inventory Sales
Damped-trend performance 11-oz. Corn chips Outlier
Safety stocks vs. forecast errors Safety stock Forecast errors
11-Oz. Corn chips Target vs. actual packaging inventory Actual Inventory from subjective forecasts Actual Inventory from subjective forecasts Target maximum inventory based on damped trend Month Monthly Usage
How to forecast regional demand Forecast total units with the damped trend Forecast regional percentages with simple exponential smoothing
Target Inventory Analysis • Actual inventory based on subjective decisions: $182.6 million • Target inventory based on the damped trend and EOQ/Safety stocks: $135.0 million • Projected savings: $47.6 million
What to Stock? Compare costs Cost to stock = (Avg inventory balance x holding rate) + (number of stock orders x transportation cost) Cost to not stock = Number of customer orders x transportation cost Transportation costs for not stocking may be both in- and out bound, depending on whether we choose to drop-ship from the vendor
What to Stock? (cont.) Simplify decisions using “hit” rules A “hit” is one customer order for any number of units. Cost comparisons usually result in minimum number of hits that must occur before it is economical to stock. Example: Class A 6 hits in 6 months Class B 4 hits in 6 months Class C 3 hits in 12 months
Where to Stock? Centralized order entry is mandatory Apply the hit rules by location This automatically tailors the range of stock to the customer base at each location Must designate who suppliers whom when a hit occurs at a non-stocking location Recognize that consolidating stocks makes dramatic reductions in total inventory investment
Effects of Consolidating Inventories: Manufacturer of Communication Systems Investment (millions) Number of Warehouses
The Economic Order Quantity (EOQ) Controls Cost per order Holding rate (% of inventory value) The EOQ Increases with the order cost Decreases with the holding rate Do not treat order cost and holding rate as fixed values. Instead, do what-if analysis to hit target values for Inventory investment on the balance sheet Stock replenishment workload
Communications Systems Manufacturer:Target inventory values for fiscal 2009
Conclusions Forecasting drives any inventory control system Standard ABC classification doesn’t go far enough Decision rules for what/where to stock must be established early
Conclusions (cont.) Performance measurement is essential to: Justify a new system Tailor the system to the inventory Track progress
Conclusions (cont.) The best inventory system is likely to be a hybrid of: JIT MRP EOQ Annual buy