Download

1 / 23
300 likes | 722 Vues
U.S. Population Trends. September 13, 1999. Total Population: 1900 to 2050. Millions. Population Change per Decade: 1900 to 2050. Change (in millions). Average Annual Growth Rate During the Decade: 1900 to 2050. Percent Change. U.S. Births, Deaths, and Net Migrants: 1900 to 2050.

E N D
U.S. Population Trends September 13, 1999
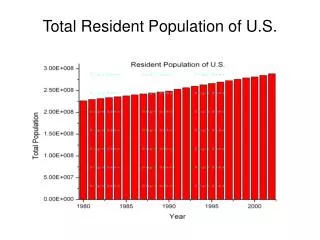
Total Population: 1900 to 2050 Millions
Population Change per Decade: 1900 to 2050 Change (in millions)
Average Annual Growth RateDuring the Decade: 1900 to 2050 Percent Change
U.S. Births, Deaths, and Net Migrants: 1900 to 2050 Millions
U.S. Birth, Death, and Net Migration Rate: 1900 to 2050 Per 1,000 population
Birth, Death, and Net Migration Rate, and Rate of Natural Increase and Growth Rate: 1998 Country/Region CBR CDR NMR RNI G.R. World 22.2 9.1 --- 1.3 1.3 More Developed U.S. 14.4 8.8 3.0 0.6 0.9 Other Developed 10.3 10.9 1.2 -0.1 0.1 Less Developed 25.0 8.8 -0.4 1.6 1.6 Crude birth, Crude death, and Net migration rates are per 1,000 population. Rate of Natural Increase and Growth rate are expressed in percent.
Births, Deaths, and Natural Increase: 1998 Country/Region Births Deaths Natural increase United States 3,892 2,379 1,514 Other Developed 9,363 9,882 -520 (Numbers in thousands)
Total Population Ranked by Country: 1998 (in millions) 1. China 1,266 6. Russia 147 2. India 983 7. Pakistan 135 3. U.S. 270 8. Bangladesh 128 4. Indonesia 213 9. Japan 126 5. Brazil 170 10. Nigeria 111
Total Population, by Region: 1900 to 2020 South West Millions Midwest Northeast
U.S. Population Distribution by Region: 1980, 2000, and 2020 1980 2000 2020
Percent of U.S. Population Living in Metropolitan Areas: 1900 to 1996 Percent
Percent of U.S. Population Living in Metropolitan Areas, by Region: 1950 and 1996 Percent
Percent of U.S. Population Living in Metropolitan Areas, by Size of Metropolitan Area Population: 1950 to 1996 79.8 77.5 74.8 69.0 63.3 56.1
Age Distribution of the U.S. Population, by Sex: 1950 Male Female Millions
Age Distribution of the U.S. Population, by Sex: 2000 Male Female = Year 1950 Millions
Age Distribution of the U.S. Population, by Sex: 2050 Male Female = Year 2000 Millions
Median Age: 1900 to 2050 Years
U.S. Population, by Race: 1900 to 2050 White Percent Black Other
Projected U.S. Population Growth: 2000 to 2050 White* Millions Hispanic Black* API* AIEA* * Excludes people of Hispanic origin
U.S. Population by Race: 1980, 2000, and 2020 1980 2000 2020 * Excludes people of Hispanic origin