Download
1 / 89
900 likes | 1.09k Vues
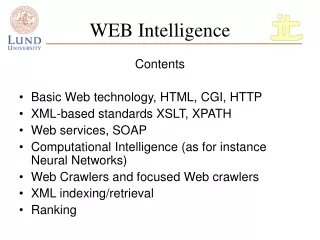
Enterprise Reporting Advanced Web Intelligence Training. Enterprise Reporting Services. Table of Contents. Introductions. Your name? Your agency? How have you been using ER Web Intelligence?. Chapter 1. Overview. Course Objectives.

E N D
Enterprise Reporting Advanced Web Intelligence Training Enterprise Reporting Services
Introductions Your name? Your agency? How have you been using ER Web Intelligence?
Chapter 1 Overview
Course Objectives At the conclusion of class participants should have an understanding of the these Web Intelligence features:
Additional Resources Toolbar Crosswalk • http://des.wa.gov/SiteCollectionDocuments/ITSolutions/Enterprise%20Reporting/story.html SAP Business Objects Web Intelligence Product Tutorials • http://scn.sap.com/docs/DOC-7819
Hours of Operation ER Hours of Operation • 24/7 for viewing reports • Daily AFRS Data updates are from 8 pm through Midnight – New and existing AFRS queries cannot be generated during this time System Maintenance – Between 12:00 am and 7:30 am on the Last Monday of every month Getting Support • 8:00 a.m. to 5:00 p.m. Monday through Friday • 360-407-9100 • solutionscenter@des.wa.gov
Chapter 2 Web Intelligence Access
Web Intelligence access Web Intelligence customers must have online access either through the State Governmental Network (SGN) or through Secure Access WA (SAW) for use from outside of the state firewall. This guide only includes information for access within the SGN. For access using SAW please consult the instructions at: http://des.wa.gov/SiteCollectionDocuments/ITSolutions/Enterprise%20Reporting/WEBI%20SAW%20Instructions.pdf
Access through SGN Type https://reporting.des.wa.gov into the address bar of your internet browser and click Go, or press [Enter]. • Enter your assigned User Name in the User Name field • Enter your Password in the Password field. • This application requires a hardened password. Refer to the password guidelines on the next page. • Click the Log On button or press [Enter] to initiate a connection to the Web Intelligence.
Password Requirements The hardened password criteria is as follows: • Password must be at least eight characters long. • Password must contain at least two of the following character classes: upper case letters, lower case letters, numerals, and special characters. It cannot contain your logon ID. • Password must be changed every 120 days. • After five incorrect logon attempts, your user account will be locked.
Chapter 3 BI Launch Pad Navigation
BI Launch Pad Navigation The “Home” tab allows for quick access to: Recently Viewed Reports Unread Business Objects Inbox Items Recently Run Reports Unread Alerts (Currently not in use) Applications
Folder Structure The “Documents” tab allows access to My Documents – Access to personal documents. Other users will not have access to these documents. Folders – Access to Agency and other public folders. Personal Categories – Allows users to group reports that are used frequently together regardless of their folder. Search – Allow users to search for documents and objects stored in Web Intelligence.
Viewing Existing Documents The BI Launch Pad allows for the viewing of existing Web Intelligence Reports. To view an existing Web Intelligence Report: Click on the report in the Recently Viewed or Recently Run lists on the “Home” tab or select the “Documents” tab. Select the correct folder where you need to view your report(s). In the example below we are looking in “My Documents” and “My Favorites”. Right Click on the report you wish to view and from the menu select “View”.
Viewing Existing Documents The report will open in view mode. To navigate you can scroll up and down or left and right, and advance pages using the page navigation controls located on the bottom of the page.
Chapter 4 Nested Query Filter
Modify a Document Locate your query in your [My Favorites] folder Right click Select “Modify”
Modify a Document Select the Data Access tab and click the Edit icon located on the Data Providers sub tab.
Nested Query Filters Nesting query filters allows you to create more complex filter conditions than is possible when you combine filters at the same level. To create a nested query filter follow the following steps. Select the field you want to nest.
Nested Query Filters Drag the filter over the filter you wish to nest with.
Nested Query Filters The query should look similar to this.
Nested Query Filters Define the query value.
Nested Query Filters 5. Click the indented And to make it an Or. Then run your query.
Chapter 5 Working with Report Tables
Sorting The default sort order for the table data is left to right. The primary sort is the left most column. To set your own sort order follow these steps. Select the data you wish to sort in the table.
Sorting Under the Analysis tab on the Display sub-tab click on Sort. This will sort the data in your report by the column selected.
Creating Sections Sections allow you to split report information into smaller, more comprehensible parts. You can create a single section or include multiple sections with subsections in a report. You can also remove and reposition sections within a report. You cannot use a measure to create a section. Use the following steps to create sections in a report. Select the data you wish to use as your section.
Creating Sections Right click on the data element and select Set as Section from the context menu.
Creating Sections The report will now be displayed in sections based on the data element selected.
Chapter 6 Data Tracking
Data Tracking Web Intelligence allows you to track and display data changes to help you focus your analysis on key areas. When you track data changes, you select a particular data refresh as a reference point. This data is known as the reference data. When you display the data changes, Web Intelligence places your current data in context by showing how it relates to the reference data. Web Intelligence allows you to track the following types of data change:
Data Tracking To activate data tracking click on Track Changes on the bottom of the screen.
Data Tracking When the Data Tracking window opens select whether to compare with last data refresh or with a certain date in time. Select which reports to have data tracking. Select whether to refresh now.
Data Tracking When the data is refreshed it will automatically show the where the changes in the data are. Track changes can be toggled to display or not by clicking on the Show Changes button located under the Analysis tab and Data Tracking sub-tab.
Chapter 7 On-Report Filtering
On-Report Filtering You can filter reports to limit the results that are displayed to specific information that interests you. The data you filter out remains within the Web Intelligence document; it is simply not displayed in the report tables or charts. This means you can change or remove report filters in order to view the hidden values, without modifying the query definition behind the document. You can apply different filters to different parts of a report. For example, you can limit the results in the entire report to a specific dimension value and then limit results in a table or chart further to focus on results for a different dimension. You can include multiple filters in a report.
On-Report Filtering You can apply filters at two levels within a document: Query filters – these filters are defined on the query; they limit the data retrieved from the data source and returned to the Web Intelligence document. Report filters – these filters limit the values displayed on reports, tables, charts, sections within the document, but they don’t modify the data that is retrieved from the data source; they simply hide values at the report level.
Report Filters To set a filter on a table, select the column with the data to be filtered by clicking in the data. Under the Analysis tab on the Filters sub-tab click Filters.
Report Filters When the Report Filter box opens type the value(s) you want to retrieve in the box, or select the value(s) you want to retrieve from the displayed List of Values and add them to the Selected Values box by clicking the > button. Then click OK.
Report Filters The report will now be filtered by the values selected. Filters can edited by clicking on the column that contains the filter and selecting edit filter from the Filter drop down list.
Report Filters Report filters can be viewed by clicking on the Document Structure and Filters button in the list of icons along the left side of the screen. Filters will be displayed with a gold funnel icon.
Input Controls Input controls provide a convenient, easily-accessible method for filtering and analyzing report data. You define input controls using standard windows controls such as text boxes and radio buttons. You associate these controls with report elements such as tables or section headers, and use the controls to filter the data in the report elements. When you select values in the input control, Web Intelligence filters the values in the associated report elements. To add an input control follow these steps. Select the column with the data to be filtered by clicking in the data. Under the Analysis tab and Filters sub-tab click the Controls button.
Input Controls In the Define Input Control box check to make sure the right dimension is selected and click Next. Select the type of input control to add and set the options. Then click Next. • There is a description of the combo box type in the top right corner of the Define Input Control box.
Input Controls Select the report elements to assign the input control to. Input Controls can be assigned to the entire report(s) or certain elements. Click Finish.
Input Controls You can now use the Input Control to filter your report. Input Controls can be accessed by clicking on the Input Controls icon along the left side of the screen.
Chapter 8 Formulas and Variables
Formulas and Variables Formulas are custom calculations allowing additional calculations beyond the base objects and standard calculations. Variables are formulas or syntax statements that have been assigned a name. Variables can be used in tables and formulas in exactly the same way as other report objects. Variables appear in the formula editor under the Variables folder. Variables can be used to simplify complex formulas by breaking a complex formula down into manageable parts and making it much easier to read, as well as making building formulas much less error-prone.