Download
1 / 9
90 likes | 172 Vues
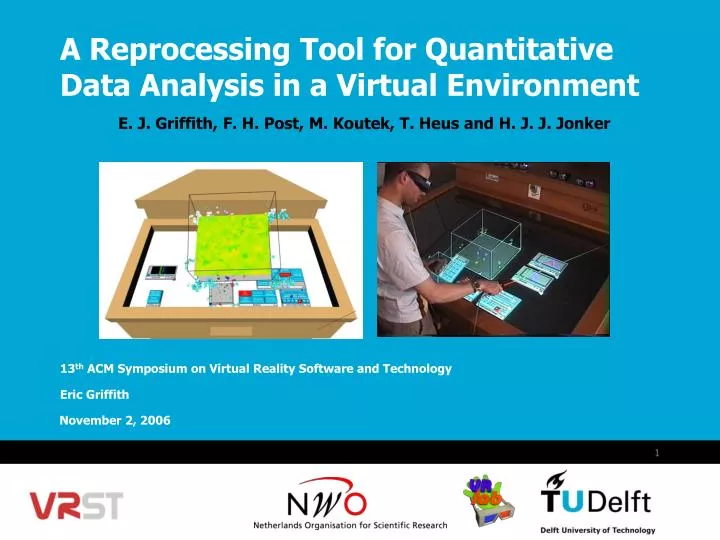
E. J. Griffith, F. H. Post, M. Koutek, T. Heus and H. J. J. Jonker. A Reprocessing Tool for Quantitative Data Analysis in a Virtual Environment. 13 th ACM Symposium on Virtual Reality Software and Technology. Eric Griffith.

E N D
E. J. Griffith, F. H. Post, M. Koutek, T. Heus and H. J. J. Jonker A Reprocessing Tool for Quantitative Data Analysis in a Virtual Environment 13th ACM Symposium on Virtual Reality Software and Technology Eric Griffith
Introduction▪ Method Overview▪ Software System▪ Case Study▪ Conclusion▪ Questions Introduction • Scientific analysis is an iterative, exploratory process • Analysis of very large, time-dependant data sets is both time consuming and difficult • We attempt to ease and speed the process • Data “reprocessing” • Interactive VR visualization
Introduction ▪ Method Overview▪ Software System▪ Case Study▪ Conclusion▪ Questions Method Overview • Generate Raw Data • Initial Preprocessing • VR Visualization • Study Objects in VR • Data “Reprocessing” • Produce Final Results
Introduction ▪ Method Overview▪ Software System▪ Case Study▪ Conclusion▪ Questions Software System – Preprocessing • Data described in an XML file • Data transformations • Expression parsing • Scalar and vector data • Output options • Downsampled/Extract versions • Generated data • New data is added by editing the XML file and reprocessing the data • Only new output is generated <input path=“/data/simulation001”> <variable name=“ql” file=“ql.001” /> <time steps=“2000” /> <grid x=“256” y=“256” z=“160” /> </input> bin_grid = bin(grid) volume = sum(bin_grid) ql_vec = sumdim(sumdim(grid, 0), 0) / sumdim(sumdim(bin_grid, 0), 0)
Introduction ▪ Method Overview▪ Software System▪ Case Study▪ Conclusion▪ Questions Software System – Visualization • Focus on interesting objects • Select/manipulate objects • Properties in graph window(s) • Slice through volumetric data • Browse through time • Extend time spent with the VE by including new data
Introduction ▪ Method Overview▪ Software System▪ Case Study▪ Conclusion▪ Questions Case Study – Cumulus Clouds • LES of shallow cumulus clouds • Identified interesting clouds • Plotted cloud top/bottom vs. time • Integrated liquid water over x and y and plotted vs. time • Noted pulse-like behavior of clouds • Verified with buoyancy • Repeated for numerous clouds to generalize results • Further examined behavior in the VE
Introduction ▪ Method Overview▪ Software System▪ Case Study▪ Conclusion▪ Questions Case Study – Video Example from our research
Introduction ▪ Method Overview▪ Software System▪ Case Study▪ Conclusion▪ Questions Conclusions and Future Directions • Conclusions: • Faster turnaround between computation and visualization • More information in the virtual environment • Easily incorporate new information in the VE • Future Directions: • More extensive use of the software within our research • More and varied data included in the VE • Move towards interactive computation from within the VE • Ultimate goal is an environment where virtual experiments can be performed within the VE
Introduction ▪ Method Overview▪ Software System▪ Case Study▪ Conclusion▪ Questions Questions