Download
1 / 1
10 likes | 103 Vues
Satellite Microwave Detection of Boreal Forest Recovery from Large-Scale Wildfires Matthew O. Jones 1,2 , John S. Kimball 1,2 , Lucas A. Jones 1,2 , Kyle C. McDonald 3,4

E N D
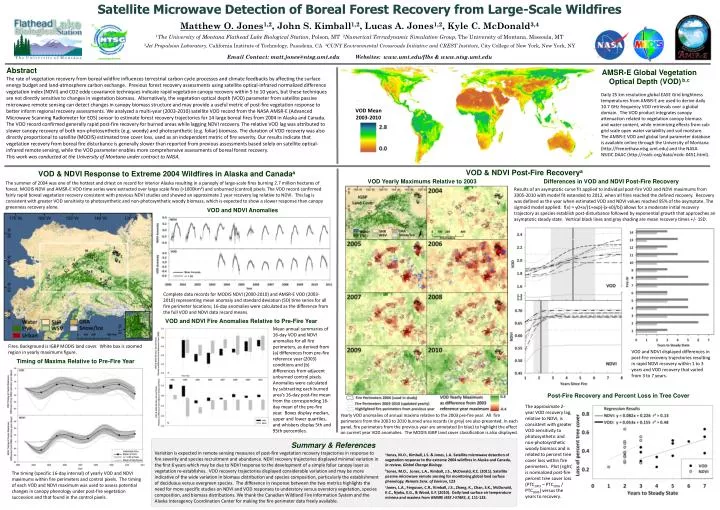
Satellite Microwave Detection of Boreal Forest Recovery from Large-Scale Wildfires Matthew O. Jones1,2, John S. Kimball1,2, Lucas A. Jones1,2, Kyle C. McDonald3,4 1The University of Montana Flathead Lake Biological Station, Polson, MT 2Numerical Terradynamic Simulation Group, The University of Montana, Missoula, MT 3Jet Propulsion Laboratory, California Institute of Technology, Pasadena, CA 4CUNY Environmental Crossroads Initiative and CREST Institute, City College of New York, New York, NY Email Contact: matt.jones@ntsg.umt.edu Websites: www.umt.edu/flbs & www.ntsg.umt.edu Abstract AMSR-E Global Vegetation Optical Depth (VOD)b,c The rate of vegetation recovery from boreal wildfire influences terrestrial carbon cycle processes and climate feedbacks by affecting the surface energy budget and land-atmosphere carbon exchange. Previous forest recovery assessments using satellite optical-infrared normalized difference vegetation index (NDVI) and CO2 eddy covariance techniques indicate rapid vegetation canopy recovery within 5 to 10 years, but these techniques are not directly sensitive to changes in vegetation biomass. Alternatively, the vegetation optical depth (VOD) parameter from satellite passive microwave remote sensing can detect changes in canopy biomass structure and may provide a useful metric of post-fire vegetation response to better inform regional recovery assessments. We analyzed a multi-year (2003-2010) satellite VOD record from the NASA AMSR-E (Advanced Microwave Scanning Radiometer for EOS) sensor to estimate forest recovery trajectories for 14 large boreal fires from 2004 in Alaska and Canada. The VOD record confirmed generally rapid post-fire recovery for burned areas while lagging NDVI recovery. The relative VOD lag was attributed to slower canopy recovery of both non-photosynthetic (e.g. woody) and photosynthetic (e.g. foliar) biomass. The duration of VOD recovery was also directly proportional to satellite (MODIS) estimated tree cover loss, used as an independent metric of fire severity. Our results indicate that vegetation recovery from boreal fire disturbance is generally slower than reported from previous assessments based solely on satellite optical-infrared remote sensing, while the VOD parameter enables more comprehensive assessments of boreal forest recovery. This work was conducted at the University of Montana under contract to NASA. Daily 25 km resolution global EASE Grid brightness temperatures from AMSR-E are used to derive daily 10.7 GHz frequency VOD retrievals over a global domain. The VOD product integrates canopy attenuation related to vegetation canopy biomass and water content, while minimizing effects from sub-grid scale open water variability and soil moisture. The AMSR-E VOD and global land parameter database is available online through the University of Montana (http://freezethaw.ntsg.umt.edu) and the NASA NSIDC DAAC (http://nsidc.org/data/nsidc-0451.html). VOD Mean 2003-2010 VOD & NDVI Post-Fire Recoverya VOD & NDVI Response to Extreme 2004 Wildfires in Alaska and Canadaa VOD Yearly Maximums Relative to 2003 Differences in VOD and NDVI Post-Fire Recovery • The summer of 2004 was one of the hottest and driest on record for interior Alaskaresulting in a panoply of large-scale fires burning 2.7 million hectares of forest. MODIS NDVI and AMSR-E VOD time series were extracted over large scale fires (>1000km2) and unburned (control) pixels. The VOD record confirmed fairly rapid boreal vegetation recovery consistent with previous NDVI studies and showed an approximate 2 year recovery lag relative to NDVI. This lag is consistent with greater VOD sensitivity to photosynthetic and non-photosynthetic woody biomass, which is expected to show a slower response than canopy greenness recovery alone. Results of an asymptotic curve fit applied to individual post-fire VOD and NDVI maximums from 2005-2010 with model fit extended to 2012, when all fires reached the defined recovery. Recovery was defined as the year when estimated VOD and NDVI values reached 95% of the asymptote. The sigmoid model applied: f(x) = y0+a/(1+exp(-(x-x0)/b)) allows for a moderate initial recovery trajectory as species establish post-disturbance followed by exponential growth that approaches an asymptotic steady state. Vertical black lines and gray shading are mean recovery times +/- 1SD. VOD and NDVI Anomalies Complete data records for MODIS NDVI (2000-2010) and AMSR-E VOD (2003-2010) representing mean anomaly and standard deviation (SD) time series for all fire perimeter locations; 16-day anomalies were calculated as the difference from the full VOD and NDVI data record means. VOD and NDVI Fire Anomalies Relative to Pre-Fire Year Mean annual summaries of 16-day VOD and NDVI anomalies for all fire perimeters, as derived from (a) differences from pre-fire reference year (2003) conditions and (b) differences from adjacent unburned control pixels. Anomalies were calculated by subtracting each burned area’s 16-day post-fire mean from the corresponding 16-day mean of the pre-fire year. Boxes display median, upper and lower quartiles, and whiskers display 5th and 95th percentiles. Fires. Background is IGBP MODIS land cover. White box is zoomed region in yearly maximums figure. VOD and NDVI displayed differences in post-fire recovery trajectories resulting in rapid NDVI recovery within 1 to 3 years and VOD recovery that varied from 3 to 7 years. Timing of Maxima Relative to Pre-Fire Year Post-Fire Recovery and Percent Loss in Tree Cover The approximate 2-year VOD recovery lag, relative to NDVI, is consistent with greater VOD sensitivity to photosynthetic and non-photosynthetic woody biomass and is related to percent tree cover loss within fire perimeters. Plot (right) is normalized post-fire percent tree cover loss (PTC2003 – PTC2005 / PTC2003) versus the years to recovery. Yearly VOD anomalies of annual maxima relative to the 2003 pre-fire year. All fire perimeters from the 2003 to 2010 burned area records (in grey) are also presented. In each panel, fire perimeters from the previous year are annotated (in blue) to highlight the effect on current year VOD anomalies. The MODIS IGBP land cover classification is also displayed. Summary & References Variation is expected in remote sensing measures of post-fire vegetation recovery trajectories in response to fire severity and species recruitment and abundance. NDVI recovery trajectories displayed minimal variation in the first 6 years which may be due to NDVI response to the development of a simple foliar canopy layer as vegetation re-establishes. VOD recovery trajectories displayed considerable variation and may be more indicative of the wide variation in biomass distribution and species composition, particularly the establishment of deciduous versus evergreen species. The difference in response between the two metrics highlights the need for more specific studies on NDVI and VOD responses to understory versus overstory vegetation, species composition, and biomass distributions. We thank the Canadian Wildland Fire Information System and the Alaska Interagency Coordination Center for making the fire perimeter data freely available. aJones, M.O., Kimball, J.S. & Jones, L.A. Satellite microwave detection of vegetation response to the extreme 2004 wildfires in Alaska and Canada, in review, Global Change Biology. bJones, M.O., Jones, L.A., Kimball, J.S., McDonald, K.C. (2011). Satellite passive microwave remote sensing for monitoring global land surface phenology. Remote Sens. of Environ, 123 cJones, L.A., Ferguson, C.R., Kimball, J.S., Zhang, K., Chan, S.K., McDonald, K.C., Njoku, E.G., & Wood, E.F. (2010). Daily land surface air temperature minima and maxima from AMSRE IEEE J-STARS, 3, 111-123. The timing (specific 16-day interval) of yearly VOD and NDVI maximums within fire perimeters and control pixels. The timing of each VOD and NDVI maximum was used to assess potential changes in canopy phenology under post-fire vegetation succession and that found in the control pixels.