Download
1 / 11
110 likes | 118 Vues
Supplemental Figure S-I. Con. AS. LC3 / DAPI. *. *. 10. 100. 8. 80. 6. 60. LC3 puncta per cell. LC3+ cells (%). 4. 40. 2. 20. 0. 0. Con. AS. Con. AS.

E N D
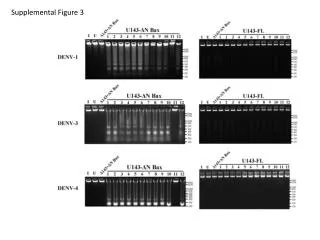
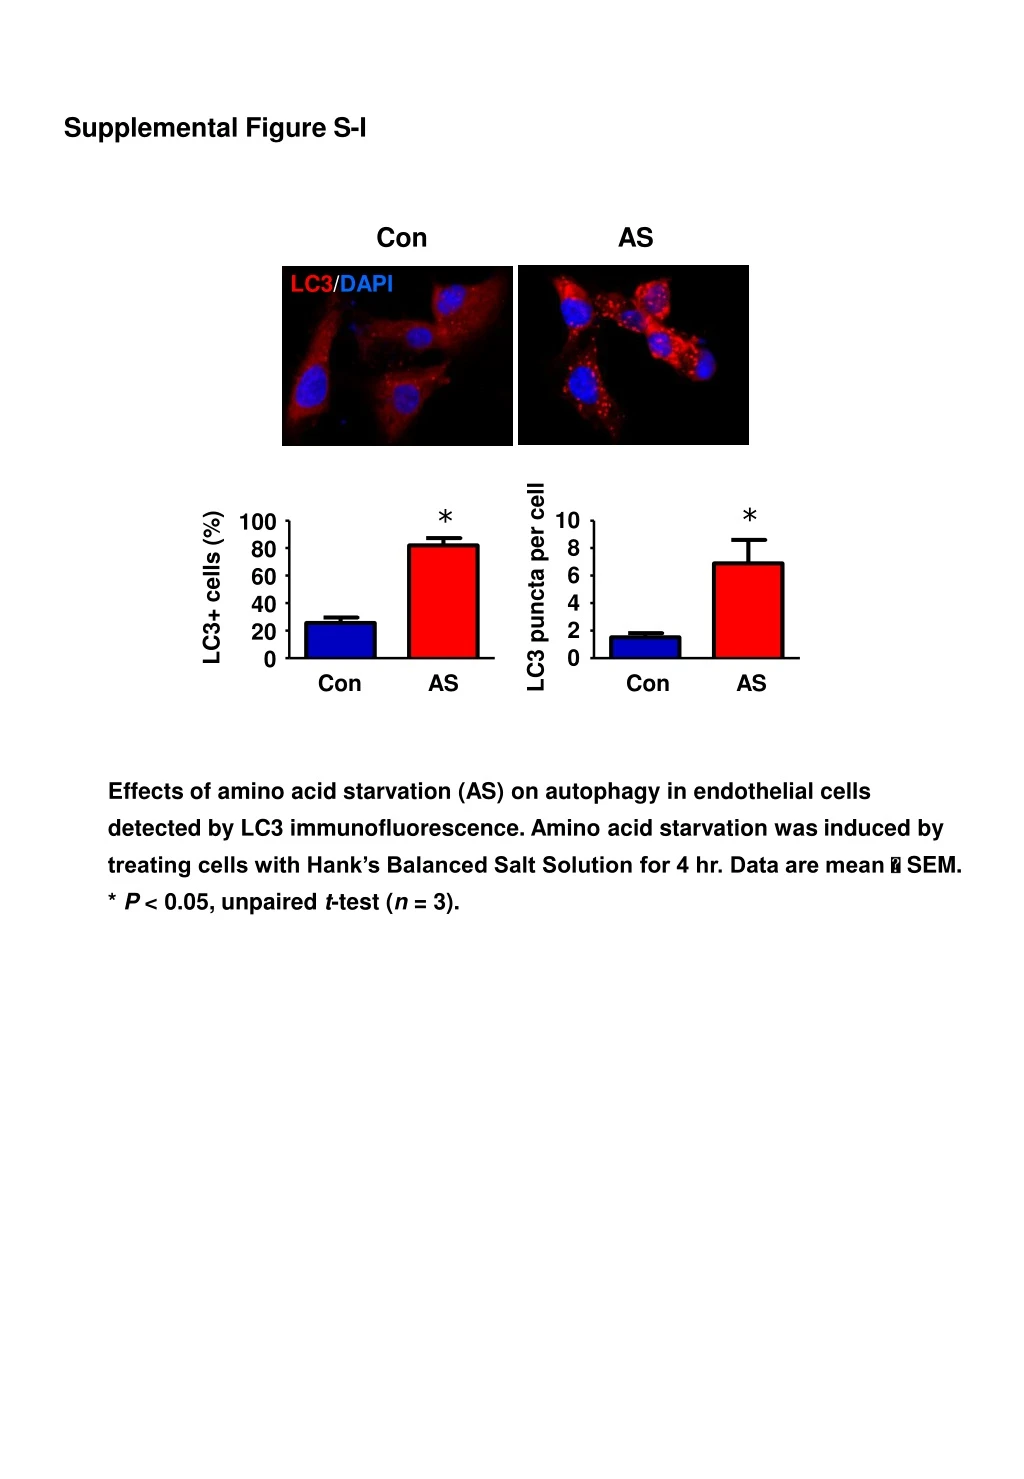
Supplemental Figure S-I Con AS LC3/DAPI * * 10 100 8 80 6 60 LC3 puncta per cell LC3+ cells (%) 4 40 2 20 0 0 Con AS Con AS Effects of amino acid starvation (AS) on autophagy in endothelial cells detected by LC3 immunofluorescence. Amino acid starvation was induced by treating cells with Hank’s Balanced Salt Solution for 4 hr. Data are mean SEM. * P < 0.05, unpaired t-test (n = 3).
Supplemental Figure S-II Flow cessation (hr) Static Flow 1 2 4 8 12 LC3/DAPI 80 10 * * * * 60 8 † † * * † 6 40 † LC3+ cells (%) † † * LC3 puncta per cell * † 4 † 20 2 0 0 1 2 4 8 12 1 2 4 8 12 S F S F Flow cessation (hr) Flow cessation (hr) LC3 immunofluorescence images and quantitative data showing the time course of the effect of flow cessation on autophagic responses in endothelial cells. Data are mean SEM. * P < 0.05 vs static (S), †P < 0.05 vs flow (F),one-way ANOVA (n = 4).
* * 15 10 LC3 puncta per cell 5 0 OF LowF Static LF Supplemental Figure S-III Effects of different types of flow on autophagy in endothelial cells detected by LC3 immunofluorescence. LF, laminar flow (12 dyn/cm2); LowF, low magnitude flow (4 dyn/cm2); OF, oscillatory flow ( 5 dyn/cm2 at 1 Hz). Data are mean SEM. * P < 0.05, one-way ANOVA (n = 4).
Supplemental Figure S-IV Con Chloroquine 5 * 4 3 Relative fluorescence intensity (fold) 2 1 0 Con Chloroquine Effects of chloroquine (50 M) on autophagic flux in static endothelial cells detected by LC3 immunofluorescence (red). DMSO was used as vehicle control. Cells were counterstained with DAPI (blue). * P < 0.05, unpaired t-test (n = 3).
Supplemental Figure S-V * * 10 8 * 6 Relative fluorescence intensity (fold) * 4 2 0 Static Shear Static Shear + bafilomycin Effects of laminar flow on LC3 puncta accumulation in the absence and presence of bafilomycin A1 (10 nM) pretreatment. Cells were counterstained with DAPI (blue). * P < 0.05, one-way ANOVA (n = 4).
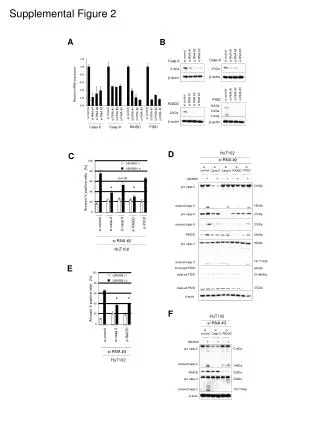
Supplemental Figure S-VI (A) ULK1 mTOR 1.5 1.5 1.0 1.0 Phospho/total ratio (fold) 0.5 0.5 0 0 Static Flow Static Flow * (B) 3 2 Relative density (fold) 1 0 Static Flow Densitometry data of western blot experiments showing the effects of laminar flow (20 dyn/cm2) on (A) phosphorylation of mTOR and ULK1 (n = 4) and (B) the protein level of Sirt1 in HUVECs. * P < 0.05, t-test (n = 4).
Supplemental Figure S-VII Static Flow Images of DCFH-DA fluorescence (green) showing that flow stimulation increased intracellular ROS production.
Supplemental Figure S-VIII (A) NS 1.0 * 0.8 Acetyl/total FoxO1 ratio (fold) 0.6 0.4 0.2 0 Static Flow Static Flow - Ex-527 + Ex-527 (B) 1.0 * 0.8 * 0.6 Acetyl/total FoxO1 ratio (fold) 0.4 0.2 0 H2O2 Con Res Western blot densitometry data showing (A) the effects of laminar flow on the level of FoxO1 acetylation in the absence and presence of EX-527 (10 M) cotreatment; and (B) the effects of resveratrol (Res) (10 M) and H2O2 (300 M) on the level of FoxO1 acetylation. Data are mean SEM. * P < 0.05 versus control, one-way ANOVA (n = 3). NS, non-significant.
FoxO1-siRNA NC #1 #2 #3 70 FoxO1 -actin 40 Supplemental Figure S-IX Western blot showing the gene silencing efficacies of different FoxO1 siRNA sequences. FoxO1 siRNAs #2 and #3 were used in the formal experiments. NC, non-targeting control RNA.
Supplemental Figure S-X Static H2O2 H2O2 + FLow Con 3-MA * 80 60 NS LC3+ cells (%) 40 20 0 Static H2O2 H2O2+ FLow Static H2O2 H2O2+ FLow Con 3-MA Immunofluorescence images of LC3 and corresponding quantitative data showing that short-term treatment with a high concentration of H2O2 (600 M for 2 hr) did not trigger autophagic responses, whereas flow-adapted cells showed increased autophagy. Flow-induced increase in autophagy was blocked in the presence of 3-MA. Data are mean SEM. * P < 0.05 one-way ANOVA (n = 4). NS, non-significant.
Supplemental Figure S-XI siRNA(#2) siRNA(#1) NC Atg5 NC Atg5 60 Atg5 -actin 40 Western blot showing the effect of Atg5 gene silencing by two different siRNA sequences on the protein level of Atg5. NC, non-targeting control.