Download
1 / 67
670 likes | 854 Vues
Chapter 5 Sampling Distribution Models and the Central Limit Theorem. Probabilistic Fundamentals of Statistical Inference. Probability:. Statistics:. From sample to the population (induction). From population to sample (deduction). Sampling Distributions.

E N D
Chapter 5Sampling Distribution Models and the Central Limit Theorem Probabilistic Fundamentals of Statistical Inference
Probability: Statistics: From sample to the population (induction) • From population to sample (deduction)
Sampling Distributions • Population parameter: a numerical descriptive measure of a population. (for example: , p (a population proportion); the numerical value of a population parameter is usually not known) Example: = mean height of all NCSU students p=proportion of Raleigh residents who favor stricter gun control laws • Sample statistic: a numerical descriptive measure calculated from sample data. (e.g, x, s, p (sample proportion))
Parameters; Statistics • In real life parameters of populations are unknown and unknowable. • For example, the mean height of US adult (18+) men is unknown and unknowable • Rather than investigating the whole population, we take a sample, calculate a statistic related to the parameter of interest, and make an inference. • The sampling distribution of the statistic is the tool that tells us how close the value of the statistic is to the unknown value of the parameter.
DEF: Sampling Distribution • The sampling distribution of a sample statistic calculated from a sample of n measurements is the probability distribution of values taken by the statistic in all possible samples of size n taken from the same population. Based on all possible samples of size n.
In some cases the sampling distribution can be determined exactly. • In other cases it must be approximated by using a computer to draw some of the possible samples of size n and drawing a histogram.
Sampling distribution of p, the sample proportion; an example • If a coin is fair the probability of a head on any toss of the coin is p = 0.5. • Imagine tossing this fair coin 5 times and calculating the proportion p of the 5 tosses that result in heads (note that p = x/5, where x is the number of heads in 5 tosses). • Objective: determine the sampling distribution of p, the proportion of heads in 5 tosses of a fair coin.
Sampling distribution of p (cont.) Step 1:The possible values of p are0/5=0, 1/5=.2, 2/5=.4, 3/5=.6, 4/5=.8, 5/5=1 • Binomial Probabilities p(x) for n=5, p = 0.5 x p(x) 0 0.03125 1 0.15625 2 0.3125 3 0.3125 4 0.15625 5 0.03125 The above table is the probability distribution of p, the proportion of heads in 5 tosses of a fair coin.
Sampling distribution of p (cont.) • E(p) =0*.03125+ 0.2*.15625+ 0.4*.3125 +0.6*.3125+ 0.8*.15625+ 1*.03125 = 0.5 = p (the prob of heads) • Var(p) = • So SD(p) = sqrt(.05) = .2236 • NOTE THAT SD(p) =
Expected Value and Standard Deviation of the Sampling Distribution of p • E(p) = p • SD(p) = where p is the “success” probability in the sampled population and n is the sample size
Shape of Sampling Distribution of p • The sampling distribution of p is approximately normal when the sample size n is large enough. n large enough means np>=10 and nq>=10
Shape of Sampling Distribution of p Population Distribution, p=.65 Sampling distribution of p for samples of size n
Example • 8% of American Caucasian male population is color blind. • Use computer to simulate random samples of size n = 1000
The sampling distribution model for a sample proportion p Provided that the sampled values are independent and the sample size n is large enough, the sampling distribution of p is modeled by a normal distribution with E(p) = p and standard deviation SD(p) = , that is where q = 1 – p and where n large enough means np>=10 and nq>=10 The Central Limit Theorem will be a formal statement of this fact.
Example: binge drinking by college students • Study by Harvard School of Public Health: 44% of college students binge drink. • 244 college students surveyed; 36% admitted to binge drinking in the past week • Assume the value 0.44 given in the study is the proportion p of college students that binge drink; that is 0.44 is the population proportion p • Compute the probability that in a sample of 244 students, 36% or less have engaged in binge drinking.
Example: binge drinking by college students (cont.) • Let p be the proportion in a sample of 244 that engage in binge drinking. • We want to compute • E(p) = p = .44; SD(p) = • Since np = 244*.44 = 107.36 and nq = 244*.56 = 136.64 are both greater than 10, we can model the sampling distribution of p with a normal distribution, so …
Example: texting by college students • 2008 study : 85% of college students with cell phones use text messaging. • 1136 college students surveyed; 84% reported that they text on their cell phone. • Assume the value 0.85 given in the study is the proportion p of college students that use text messaging; that is 0.85 is the population proportion p • Compute the probability that in a sample of 1136 students, 84% or less use text messageing.
Example: texting by college students (cont.) • Let p be the proportion in a sample of 1136 that text message on their cell phones. • We want to compute • E(p) = p = .85; SD(p) = • Since np = 1136*.85 = 965.6 and nq = 1136*.15 = 170.4 are both greater than 10, we can model the sampling distribution of p with a normal distribution, so …
Another Population Parameter of Frequent Interest: the Population Mean µ • To estimate the unknown value of µ, the sample mean x is often used. • We need to examine the Sampling Distribution of the Sample Mean x (the probability distribution of all possible values of x based on a sample of size n).
Example • Professor Stickler has a large statistics class of over 300 students. He asked them the ages of their cars and obtained the following probability distribution: x 2 3 4 5 6 7 8 p(x) 1/14 1/14 2/14 2/14 2/14 3/14 3/14 • SRS n=2 is to be drawn from pop. • Find the sampling distribution of the sample mean x for samples of size n = 2.
Solution • 7 possible ages (ages 2 through 8) • Total of 72=49 possible samples of size 2 • All 49 possible samples with the corresponding sample mean are on p. 5 of the class handout.
Solution (cont.) • Probability distribution of x: x 2 2.5 3 3.5 4 4.5 5 5.5 6 6.5 7 7.5 8 p(x) 1/196 2/196 5/196 8/196 12/196 18/196 24/196 26/196 28/196 24/196 21/196 18/196 9/196 • This is the sampling distribution of x because it specifies the probability associated with each possible value of x • From the sampling distribution above P(4 x 6) = p(4)+p(4.5)+p(5)+p(5.5)+p(6) = 12/196 + 18/196 + 24/196 + 26/196 + 28/196 = 108/196
Expected Value and Standard Deviation of the Sampling Distribution of x
Example (cont.) • Population probability dist. x 2 3 4 5 6 7 8 p(x) 1/14 1/14 2/14 2/14 2/14 3/14 3/14 • Sampling dist. of x x 2 2.5 3 3.5 4 4.5 5 5.5 6 6.5 7 7.5 8 p(x)1/196 2/196 5/196 8/196 12/196 18/196 24/196 26/196 28/196 24/196 21/196 18/196 9/196
Mean of sampling distribution of x: E(X) = 5.714 Population probability dist. x 2 3 4 5 6 7 8 p(x) 1/14 1/14 2/14 2/14 2/14 3/14 3/14 Sampling dist. of x x 2 2.5 3 3.5 4 4.5 5 5.5 6 6.5 7 7.5 8 p(x) 1/196 2/196 5/196 8/196 12/196 18/196 24/196 26/196 28/196 24/196 21/196 18/196 9/196 E(X)=2(1/14)+3(1/14)+4(2/14)+ … +8(3/14)=5.714 Population mean E(X)= = 5.714 E(X)=2(1/196)+2.5(2/196)+3(5/196)+3.5(8/196)+4(12/196)+4.5(18/196)+5(24/196) +5.5(26/196)+6(28/196)+6.5(24/196)+7(21/196)+7.5(18/196)+8(9/196) = 5.714
Example (cont.) SD(X)=SD(X)/2 =/2
x 1 2 3 4 5 6 p(x) 1/6 1/6 1/6 1/6 1/6 1/6 Sampling Distribution of the Sample Mean X: Example • An example • A die is thrown infinitely many times. Let X represent the number of spots showing on any throw. • The probability distribution of X is E(X) = 1(1/6) +2(1/6) + 3(1/6) +……… = 3.5 V(X) = (1-3.5)2(1/6)+ (2-3.5)2(1/6)+ ……… ………. = 2.92
Suppose we want to estimate m from the mean of a sample of size n = 2. • What is the sampling distribution of in this situation?
E( ) =1.0(1/36)+ 1.5(2/36)+….=3.5 V(X) = (1.0-3.5)2(1/36)+ (1.5-3.5)2(2/36)... = 1.46 6/36 5/36 4/36 3/36 2/36 1/36 1 1.5 2.0 2.5 3.0 3.5 4.0 4.5 5.0 5.5 6.0
Notice that is smaller than Var(X). The larger the sample size the smaller is . Therefore, tends to fall closer to m, as the sample size increases. 1 6 1 6 1 6
The variance of the sample mean is smaller than the variance of the population. Mean = 1.5 Mean = 2. Mean = 2.5 1.5 2.5 Population 2 1 2 3 1.5 2.5 2 1.5 2 2.5 1.5 2 2.5 1.5 2.5 Compare the variability of the population to the variability of the sample mean. 2 1.5 2.5 Let us take samples of two observations 1.5 2 2.5 1.5 2 2.5 1.5 2.5 2 1.5 2.5 1.5 2 2.5 1.5 2 2.5 1.5 2 2.5 Also, Expected value of the population = (1 + 2 + 3)/3 = 2 Expected value of the sample mean = (1.5 + 2 + 2.5)/3 = 2
µ Unbiased Unbiased Confidence l Precision l The central tendency is down the center BUS 350 - Topic 6.1 6.1 - 14 Handout 6.1, Page 1
A Billion Dollar Mistake • “Conventional” wisdom: smaller schools better than larger schools • Late 90’s, Gates Foundation, Annenberg Foundation, Carnegie Foundation • Among the 50 top-scoring Pennsylvania elementary schools 6 (12%) were from the smallest 3% of the schools • But …, they didn’t notice … • Among the 50 lowest-scoring Pennsylvania elementary schools 9 (18%) were from the smallest 3% of the schools
A Billion DollarMistake (cont.) • Smaller schools have (by definition) smaller n’s. • When n is small, SD(x) = is larger • That is, the sampling distributions of small school mean scores have larger SD’s • http://www.forbes.com/2008/11/18/gates-foundation-schools-oped-cx_dr_1119ravitch.html
We Know More! • We know 2 parameters of the sampling distribution of x :
THE CENTRAL LIMIT THEOREM The World is Normal Theorem
Sampling Distribution of x- normally distributed population n=10 Sampling distribution of x: N( , /10) /10 Population distribution: N( , )
Normal Populations • Important Fact: • If the population is normally distributed, then the sampling distribution of x is normally distributed for any sample size n. • Previous slide
Non-normal Populations • What can we say about the shape of the sampling distribution of x when the population from which the sample is selected is not normal?
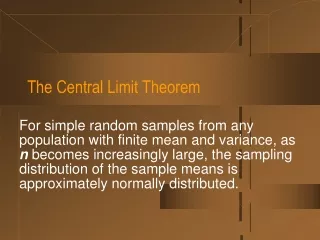
The Central Limit Theorem(for the sample mean x) • If a random sample of n observations is selected from a population (any population), then when n is sufficiently large, the sampling distribution of x will be approximately normal. (The larger the sample size, the better will be the normal approximation to the sampling distribution of x.)
The Importance of the Central Limit Theorem • When we select simple random samples of size n, the sample means we find will vary from sample to sample. We can model the distribution of these sample means with a probability model that is
How Large Should n Be? • For the purpose of applying the central limit theorem, we will consider a sample size to be large when n > 30.
Summary Population: mean ; stand dev. ; shape of population dist. is unknown; value of is unknown; select random sample of size n; Sampling distribution of x: mean ; stand. dev. /n; always true! By the Central Limit Theorem: the shape of the sampling distribution is approx normal, that is x ~ N(, /n)