Download
1 / 43
440 likes | 482 Vues
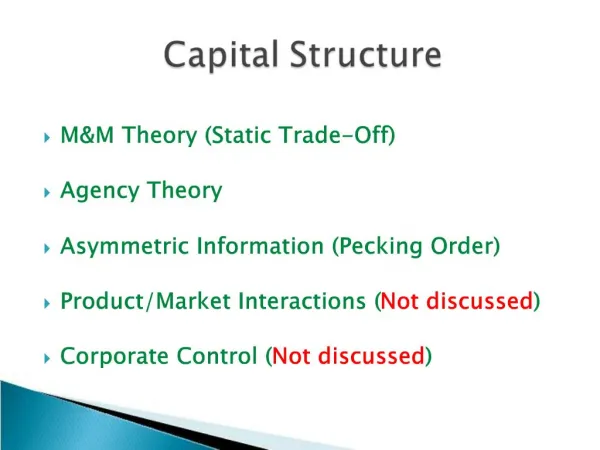
Capital Structure. Joseph V. Rizzi Amsterdam Institute of Finance November, 2009. Approaches To Credit Analysis. Cash Flow Impacts default risk Balance Sheet Determines Loss in Event of Default (LIED) Liquidity Valuation. Amsterdam Institute of Finance November 2009. 2.

E N D
Capital Structure Joseph V. Rizzi Amsterdam Institute of Finance November, 2009
Approaches To Credit Analysis • Cash Flow • Impacts default risk • Balance Sheet • Determines Loss in Event of Default (LIED) • Liquidity • Valuation Amsterdam Institute of Finance November 2009 2
Credit Analysis • Business Risk: EBITDA Volatility • Industry Characteristics • Firm Characteristics • Financial Risk: EBITDA Relative to Debt • Structural Risk • Issues • Priority of claim on assets and income • Control • Focus • Covenants, Seniority, Security Amsterdam Institute of Finance November 2009
Business Risk (EBITDA Volatility) • Industry Fundamentals • Industry Growth Prospects • Competition • Cyclicality • Technology Risk • Barriers to Entry • Regulatory Environment • Foreign Exchange Risk Amsterdam Institute of Finance November 2009 • Company Fundamentals • Size • Relative Market Share • Product Type • Diversity of Product • Customer Concentrations • Supply Risks • Management Expertise • Contingencies • Labor • Environmental • Litigation • Pension
Financial Risk Debt Relative to EBITDA) • Projected Debt Service Coverage • EBITDA / Interest Expense • Credibility of Projections • Downside Coverage/Cushion • Capitalization • Purchase Price Multiple versus Comparables • Interest Rate Projections • Secondary Repayment Sources • Collateral Coverage Amsterdam Institute of Finance November 2009
Structural Risk (Claim on and control of Income/Assets) • Borrowing Entity Clearly Identified • Structural Subordination • Term Loan Amortization • Financial Covenants • Excess Cash Recapture • Subordinated Debt Provisions • Fraudulent Conveyance/Other Legal Issues • Pricing • Due Diligence • Documentation Amsterdam Institute of Finance November 2009
Credit Screening – Subject to market availability • Quantitative • Capitalization • Cash Equity >25% • Total Debt <6.0x • Senior Debt (1) <4.5x • First Lien <4.0x • Second Lien <0.5x • Cash Flow • LTM EBITDA / PFI >2:1 • 7 x LTM FFOCF / TLA(2) >1:1 • Liquidity • Cash + MS + RCA / P+I (3) > 1.5 : 1 1:- TLA usually >20% of senior debt and amortizes at least 30% by year 5 2:- FFOCF = LTM EBITDA - (WCI + CAPEX + Taxes + PF Interest) 3:- Liquidity tested day 1. MS (Marketable Securities). RCA (Revolving Credit Availability). Revolver usually set at 1 x EBITDA Amsterdam Institute of Finance November 2009
Amsterdam Institute of Finance November 2009
Debt Capacity Considerations • Debt capacity is derived from firm’s assets • Operating Cash Flows • Asset Sales / Asset Quality • Leveragability • Market Conditions • Target financing structure 2H07Crisis Credit curve shifts over time depending on the economy Rates Overheated 1H07 Rating Amsterdam Institute of Finance November 2009
Capitalization Alternatives • There are two different approaches to designing the capital structure: Balance Sheet Model Cash Flow Model 3 - 4x EBITDA 50% 4 - 6x EBITDA 30% Senior Debt Sub Debt Equity Equity 20% Amsterdam Institute of Finance November 2009
Approaches to Determining Debt Capacity • Ratio Approach • Cash Flow • Advance Rate Amsterdam Institute of Finance November 2009
Ratio Approach Market • Maximum senior debt and total debt ratios • Vary over cycle Peers • Identify • Rating Classification • Key Ratios Rating Agencies • Credit Statistics Statistical Models (KMV) Amsterdam Institute of Finance November 2009
Peer Comparison Amsterdam Institute of Finance November 2009
Rating Agencies Amsterdam Institute of Finance November 2009 • Important: Loan Market Evolution from a bank to an institutional market (back to a bank market?) • Impact: Majority of syndicated loans are rated • Pricing: Affected by rating
October 2009 Amsterdam Institute of Finance November 2009
Amsterdam Institute of Finance November 2009
Amsterdam Institute of Finance November 2009
Amsterdam Institute of Finance November 2009
Cash Flow • Maximum debt capacity formula:- MDC = f(operations, amortization, rate, asset sales) MDC = [EBIT / (i+ 1/n)] + AS + RF EBIT - Earnings Before Interest and Taxes i - Interest Rate n - Straight line loan amortization AS - Proceeds from Asset Sales RF - Refinancing Amsterdam Institute of Finance November 2009
Credibility of Cash Flow Projections • Issues • Adjustments (beware of solving for cash flows to justify price) • Normalization • Cyclicality • Bad Management • Value Test • Projections implied price • Reverse Engineer - Management implied forecast • Firms • Peers • Tie Into • Compensation • Covenants Amsterdam Institute of Finance November 2009
Advance Rate • Asset Based Lending • Receivables (80%) • Inventory (50%) • Net PP&E (40%) • Business Value Lending • Estimate business value • Take stock as collateral • Advance up to a certain percentage of business value Amsterdam Institute of Finance November 2009
Debt Capacity Approaches Cash Flow Approach Example: Based on projected cashflow's ability to service Earnings Before Interest & Taxes (EBIT) 40 debt. Multiple is a function of cash flow volatility. Add Back Non Cash Charges 10 Suitable for larger, more stable borrowers. Operating Cash Flow (EBITDA) 50 Maximum Senior Debt (4.0x EBITDA) 200 Subordinated Debt 100 Maximum Debt Capacity (6.0x EBITDA) 300 Asset Based Approach Example: Based on probable liquidation value of collateral. Receivables 100 80% 80 Advance rate is a function of the certainty of Inventory 100 50% 50 liquidation value and market to book. Suitable Fixed Assets 175 40% 70 for smaller, higher risk borrowers. Maximum Senior Debt 200 Subordinated Debt 100 Maximum Debt Capacity 300 Ratings Approach Example: 50 Using S&P's financial risk tolerance levels by S&P BBB Debt/Cap Ratio 45.6% rating category a capital structure can be designed Company Debt/Cap 50.0% to match the issuers ratings preference. Heavily Debt Capacity 0 dependent on the businesses risk profile. S&P B Debt/Cap Ratio 74.2% Company Debt/Cap 50.0% Debt Capacity 60.8 Amsterdam Institute of Finance November 2009
In Practice • Macro/Market Level • Determine rating target • Use target rating level financial characteristics • Funded Debt/EBITDA • EBITDA/Interest Expense • Funded Debt/Total Cap Example: (A) Target Rating BB (B) EBITDA/Int for Target Rating c3.0x (C) Firm EBITDA $300mln (D) Interest Rate for Target Rating 10% (E) Maximum Debt Capacity = (C/B)/D = (300/3)/10% = $1,000 Amsterdam Institute of Finance November 2009
10/22/09 Amsterdam Institute of Finance November 2009
Amsterdam Institute of Finance November 2009
Amsterdam Institute of Finance November 2009
European Insolvency Regimes Source S&P Amsterdam Institute of Finance November 2009
SCOPE: Business Bankruptcies – 1H09 US 220 UK 160 Germany 110 France 125 Amsterdam Institute of Finance November 2009
Sponsored Deals • Tend to default at same rate as similarly rated non sponsored firms • Larger deals tend to have worse performance • PE underwriting performance varies Firm Defaulted and Distressed Deals (D&D) (%) Cerberus 4(67%) Apollo 13 (65%) TH Lee 6 (55%) Carlyle 16(52%) Bain 10(45%) Goldman 8(38%) Warburg 5(36%) Providence 4(33%) TPG 6(32%) Welsh 4(31%) JPM 2(29%) Blackstone 6(27%) Madison 3(25%0 KKR 3(15%) Source: Moody’s Amsterdam Institute of Finance November 2009
Bankruptcy Legal Framework (1) • Initiation of Bankruptcy • Who has the right to file for bankruptcy? • What kinds of enterprises should be eligible to file for bankruptcy? • Can the decision to file be challenged? • When should inappropriate cases be terminated? • Preserving Firm Value / Minimizing Business Losses in Bankruptcy • Should the business be reorganized or liquidated? • How should creditors be prevented from dismembering the business? • Should the debtor be required to honor pre-bankruptcy contracts with suppliers and lenders? • Should debtor-in possession (DIP) financing be made available? Amsterdam Institute of Finance November 2009
Bankruptcy Legal Framework (2) • Corporate Governance in Bankruptcy • Should the debtor’s decision making authority be limited? • How should debtor management be monitored? • Choosing the Plan of Reorganization • Should the process be consensual or formulaic? • Who has the right to propose a plan? • How should the plan be voted upon? • How should dissenting claimholders be treated? • Should there be a time limit? • How should the debtor’s new capital structure be determined? Amsterdam Institute of Finance November 2009
Restructuring ASSETS LIABILITIES + EQUITY Equilibrium ASSETS LIABILITIES + EQUITY Restructure Amsterdam Institute of Finance November 2009
Building Blocks of A Reorganization Plan • How Big is the pie? • Valuation of LHS • How much does each claimholder receive? • RHS waterfall analysis • Legal System • How should this consideration be paid? • Cash • Instruments • How much debt can the company support after a reorganization? • - Debt capacity Amsterdam Institute of Finance November 2009
Settlement Agreement • Objective: Improve position • Pricing • Collateral • Seniority • Cash Payments • Maturity • Covenants • Control • - Force Sale • Starting Position Amsterdam Institute of Finance November 2009
Conclusion • Determining debt capacity using credit analysis • Expanding debt capacity • What to expect when you exceed debt capacity Amsterdam Institute of Finance November 2009
Lyondell Banks Lose $3.7B in loans - $20.9B Goldman - $850 ABN Amros/RBS - £1B write-off on $3.4B claim UBS - $500 Out of Season – 2H07/1H07 Amsterdam Institute of Finance November 2009
Purchase Price 20% Premium to 7/16/07 closing price Commodity Basell/Blavatnik and Lyondell – Russian Rule DIP – Debt converted into post petition financing Amsterdam Institute of Finance November 2009
Amsterdam Institute of Finance November 2009
Amsterdam Institute of Finance November 2009
Amsterdam Institute of Finance November 2009
Amsterdam Institute of Finance November 2009
Amsterdam Institute of Finance November 2009
Disclosure This information has been prepared solely for informational purposes and is not intended to provide or should not be relied upon for accounting, legal, tax, or investment advice. The factual statements herein have been taken from sources believed to be reliable, but such statements are made without any representation as to accuracy or completeness. Opinions expressed are current opinions as of the date appearing in this material only. These materials are subject to change, completion, or amendment from time to time without notice and CapGen Financial is not under any obligation to keep you advise of such changes. All views expressed in this presentation are those of the presenter, and not necessarily those of CapGen Financial. Amsterdam Institute of Finance November 2009