Download
1 / 15
150 likes | 158 Vues
Power BI provides you to create reports and dashboard. Microsoft provides the easiest way to generate the meaning from the garbage like data. Almost all big companies are using Power BI to generate or create some meaning from the raw data. Power BI reports are created in Power BI Desktop version and consumers are using Power BI service which is a web portal for accessing the content of it like reports and dashboards.<br><br>https://www.loginworks.com/blogs/basic-concepts-for-power-bi-service-consumer/

E N D
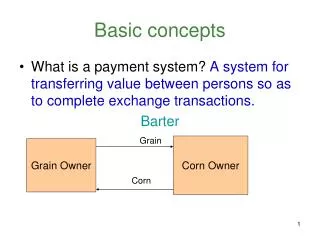
Basic Concepts For Power BI Service Consumer Hey guys, today I’m going to discuss the Concepts of Power BI Service Consumer. Before discussing it, we should know that what is a report, what is Power BI services. This is my 10th article on Power BI. You can read my previous articles to know about the Power BI in deep. Power BI provides you to create reports and dashboard. Microsoft provides the easiest way to generate the meaning from the garbage like data. Almost all big companies are using Power BI to generate or create some meaning from the raw data. Power BI reports are created in Power BI Desktop version and consumers are using Power BI service which is a web portal for accessing the content of it like reports and dashboards.
Now-a-days every company has a large amount of data that is of no use but Power BI provides you the power to create or generate some meaningful data. These reports are very useful for predicting the future of the company. Consumers are those persons who can only get the report and dashboard through Power BI service only. I’m not going to describe the things like what is Power BI report and what is the dashboard. Below are the terminology and concepts that we use in Power BI.
What you see when you open Power BI Service first Time? Not everybody is aware of the Power BI. But those people are aware of it whose company buys a license of it. You can open the link as I’m mentioning here app.powerbi.com to open the Power BI Experts. When you click on the above link you can see the page as shown below. The above view is only visible when you open the power BI service first time. You can easily customize or personalize the Power BI service. In some cases, people want to see the home page of Power BI service but others want to see their favorite reports or dashboard. So, you can adjust the home screen of your Power BI service.
Below are the screens for Home preview and content as a featured dashboard. We’ll discuss about it later on that how to do this.
Above is the home preview.Above picture shows the dashboard as featured image or content.
Power BI content There are five main building blocks in Power BI service for creating reports and dashboards. These are as follows: data set, visualization, report, dashboard and app. Other than that all the content are stored in the workspace. In the process of creation of reports first, we need to import the data set then we apply visualizations to the page to create the report or dashboard. Apps are for connecting third-party data source like Git-hub etc. Below is the flow diagram for creating a report in Power BI.
Data sets Data set is like a tank of water that stores water. In our scenario data set is a container for data that we use for creating reports and dashboard. We can take data set from any data source like Excel, text files and also we can connect the Power BI directly to the server to get the data. For example, we connect the SQL server to get the data set also we have many sources like the database, Git-hub etc. But as a consumer, we really don’t interact with the data set directly but we can interact with the data set through visuals like graphs and charts. We can see the data set in Power BI Consultant as shown in below picture.
Steps to get the data set: 1. First, select the workspace 2. Open the report 3. Then select the data set option as in the above picture We can use one data set for many reports or dashboard.
Visualization Visualization is the next after getting the data set. visualization simply means to visualize the data in the form of charts or graphs. Power BI provides lots of visuals for creating reports and dashboard. It is easier to understand data charts or graphs rather than data in tabular form. Some of the visuals available in Power BI are waterfall, line chart, bar chart, stacked bar chart, pie chart, time series, tree-map, cards etc. Below are the pictures of the same.
Reports Reports are the way to show the data in the form of visuals and table. Reports are basically summary of all data. Also, we can predict the future based on that report. The report contains one or more pages. Below is the picture of a sample report.
Dashboard A dashboard is a combination of reports. One dashboard can contain multiple visuals and these visuals can be made from multiple sources.
Apps This contains the collection of dashboard or reports that can be shared with other people or organization. This also contains the workspace created by other users which is shared with me. Below is the picture of the same.
Conclusion In this article, we have learned all the basic concept of the Power BI service consumer. I have discussed visualization, report, data set, dashboard, and app. If you want to learn more about Power BI, so you can go through my previous articles. Also, if you have any issue regarding anything then you can comment in the comment section below. Thank you!
Thanks For Watching This Video Connect With Source Url https://bit.ly/2RKOxE1 Call Us:- +1-434-608-0184