Download
1 / 42
460 likes | 659 Vues
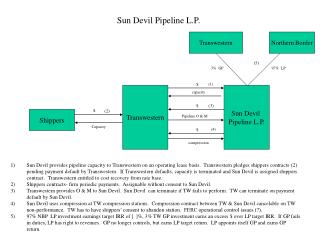
Sunoco Logistics Partners L.P. Citi MLP / Midstream Infrastructure Conference August 21-22, 2013. NYSE SXL. Forward-Looking Statements.

E N D
Sunoco Logistics Partners L.P. Citi MLP / Midstream Infrastructure Conference August 21-22, 2013 NYSE SXL
Forward-Looking Statements Statements we make that are not historical facts are forward-looking statements. These forward-looking statements are not guarantees of future performance. Although we believe the assumptions underlying these statements are reasonable, investors are cautioned that such forward-looking statements involve risks and uncertainties that may affect our business and cause actual results to differ materially from those discussed in this presentation. Such risks and uncertainties include economic, business, competitive and/or regulatory factors affecting our business, as well as uncertainties related to the outcomes of pending or future litigation. Sunoco Logistics Partners L.P. has included in its Annual Report on Form 10-K for the year ended December 31, 2012, and in its subsequent SEC filings, cautionary language identifying important factors (though not necessarily all such factors) that could cause future outcomes to differ materially from those set forth in the forward-looking statements. For more information about these factors, see our SEC filings, available on our website at www.sunocologistics.com. We expressly disclaim any obligation to update or alter these forward-looking statements, whether as a result of new information, future events or otherwise. This presentation includes certain non-GAAP financial measures intended to supplement, not substitute for, comparable GAAP measures. Reconciliations of non-GAAP financial measures to GAAP financial measures are provided in the appendix to this presentation. You should consider carefully the comparable GAAP measures and the reconciliations to those measures provided in this presentation. 2
Energy Transfer Family of Companies ENERGY TRANSFER EQUITY, L.P. (NYSE: ETE) LP Interest, GP Interest, IDRs, Class H Units* LP Interest, GP Interest, IDRs ENERGY TRANSFER PARTNERS, L.P. (NYSE: ETP) REGENCY ENERGY PARTNERS LP (NYSE: RGP) LP Interest, GP Interest, IDRs Intrastate Transportationand Storage SUNOCO LOGISTICS PARTNERS L.P. (NYSE: SXL) Gathering and Processing Interstate Transportation and Storage Contract Compression & Treating Crude Oil Pipelines Midstream Crude Oil Acquisition & Marketing Joint Ventures Sunoco, Inc. Retail Marketing Terminal Facilities NGL / Refined Product Pipelines NGL Transportation and Services 70% ETP Interest 30% RGP Interest Lone Star NGL * Class H Units track 50% of the SXL GP and IDR economics 5
2Q13 Highlights • Record quarterly performance: • $244 million Adjusted EBITDA • 5% distribution increase (quarter over quarter): • $2.29/unit to $2.40/unit (annualized) • 28% increase over 2Q12 distribution of $1.88/unit (annualized) • 3rd consecutive 5% quarterly increase; 33rd consecutive increase overall • 2013 Capital: • Approximately $700 million of organic expansion capital • Approximately $65 million of maintenance capital • Ended the quarter with a Debt to Adjusted EBITDA ratio of 2.4x 6
Distribution History Average Annual Paid Distribution (per LP unit) • Third consecutive 5% quarter over quarter distribution increase • 33 consecutive quarterly distribution increases • Current annualized distribution of $2.40 (3.7% yield as of 08/15/13) LP/GP Split (%) 50/50 $2.40 $2.11 63/37 $0.77 85/15 $0.67 98/2 Distribution Coverage 1.7x 1.5x 1.3x 1.8x 2.2x *CAD: Current Annualized Distribution @ $2.40 per LP Share 7
EBITDA by Segment ($MM) Note: The Partnership's definition of Adjusted EBITDA and DCF was revised beginning in the fourth quarter 2012. Prior period results have been recast to conform to the current presentation 8
Adjusted EBITDA: Ratable and Market Related 810 • Maximize asset base by taking advantage of market opportunities • Distributions based on ratable cash • Market related cash flow increases coverage ratio 573 399 372 319 Note: The Partnership's definition of Adjusted EBITDA and DCF was revised beginning in the fourth quarter 2012. Prior period results have been recast to conform to the current presentation 9
Major Organic Projects • Successful Open Seasons: • Three West Texas Crude expansion projects (crude oil) • Permian Express Phase I (crude oil) • Eaglebine Express (crude oil) • Allegheny Access (refined products) • Mariner West (natural gas liquids) • Mariner East (natural gas liquids) • Mariner South (natural gas liquids) • Actively developing: • Granite Wash Extension (crude oil) • Permian Express Phase II (crude oil) • Mariner East Phase II (natural gas liquids) 10
Scheduled Project Start-up Note: Nederland Access waiting on Pegasus to re-start * Currently in Open Season 11
Organic Growth Capital • Optimize current asset base • Invest in organic extensions • Organic Projects: • West Texas Crude Projects • Permian & Eaglebine Express • Mariner Projects • Allegheny Access • Nederland / Eagle Point • Butane Blending • Opportunistically acquire complementary assets: • $1.4B in 11 year history • Marcus Hook facility acquired in 2013 for $60MM in cash * 12 *SXL does not project future acquisitions
Original 110 MB/D West Texas Expansion – Crude Oil • West Texas Crude Expansion: • Strong demand for takeaway • capacity out of the Permian Basin • Existing crude pipeline • Multiple destinations • 3 Successful Open Seasons • Houston Access • – 40 MB/D (operational) • Longview Access • – 30 MB/D (operational) • Nederland Access • – 40 MB/D (waiting on Pegasus) • Fee-based income West Texas Gulf Expansion Permian Crude to Multiple Markets 13
Permian Express – Crude Oil • Additional West TX Crude Expansion: • Continued strong demand for takeaway capacity out of the Permian Basin • Phase I: Successful Open Season • Wichita Falls to Nederland • Existing pipeline • Connection to Basin Pipeline • 90 MB/D (operational) • 150 MB/D capacity (early 2014) • Phase II: Actively developing • 200 MB/D additional capacity • Origin: Permian Basin • Destinations: Multiple refiners and markets in the Mid -Continent and along the Gulf Coast Permian Express I Permian Crude to Nederland Permian Express II Permian Crude to the Mid-Continent and the Gulf Coast via SXL and 3rd party pipelines 14
Eaglebine Express – Crude Oil • ~60MB/D of takeaway capacity from the Eaglebine and Woodbine shale at Hearne to Nederland • Existing MagTex pipeline • MagTex acquired in 2008 • Underutilized refined products pipeline • Expected to be operational in the Mid-14 • Successful open season Eaglebine Express Eaglebine / Woodbine Crude to Nederland 15
Granite Wash Extension– Crude Oil • Approximately 70MB/D of takeaway capacity from the Granite Wash Shale to Ringgold • Ability to ultimately connect to multiple SXL and 3rd party pipelines • Destinations include refiners and markets in the Mid-Continent and along the Gulf Coast • ~200 miles of new pipeline • Expected to be operational in 4Q14 • Open season launched in July 2013 Granite Wash Extension Granite Wash Crude to the Mid-Continent and the Gulf Coast via SXL and 3rd party pipelines 16
Allegheny Access – Refined Products • Midwest products to Eastern Ohio • and Western Pennsylvania: • Strong demand to move • Midwest refined products east • Refinery expansions • Refinery economics • Utilizes existing and new assets • Successful Open Season • Initial capacity of 85 MB/D • Expandable to 110 MB/D • Fee-based income • Mid-14 projected start-up Allegheny Access Ohio Products to Pittsburgh 17
Mariner West and East – Natural Gas Liquids Mariner West Ethane from Houston to Sarnia Mariner East E/P from Houston to Marcus Hook 18
Mariner West and East – Details • Comprehensive Marcellus Shale Pipeline Solution • Strong demand for NGL takeaway capacity out of the Marcellus • Successful Open Seasons for both West and East • Fee-based income • Primarily existing pipeline (optimizing Northeast/Midwest refined product pipelines) • Mariner West • Ethane pipeline from Houston, PA to Sarnia, Ontario • Line fill commenced July 2013 • September 2013 at ~20 MB/D • Ramping up by 1Q14 to 50 MB/D capacity (expandable) • Mariner East • Propane and Ethane pipeline from Houston, PA to the Marcus Hook Facility • Marine terminal at Marcus Hook with export options • 70 MB/D capacity • 2H14: propane start-up; mid-15: ethane and propane • Due to substantial interest, actively developing a Phase II 19
Marcus Hook – Natural Gas Liquids • Acquired from Sunoco, Inc. – $60MM • Continued commitment to growth in natural gas liquids • Anchors the Mariner East project • Located near the Marcellus and Utica shales, the site offers many features: • Five underground caverns for storing NGLs • Deep water berths, rail access, truck capability and advantageous pipeline infrastructure • A northeast NGL hub, capable of handling a broad array of NGLs and located <300 miles from the Marcellus, is very attractive to producers as well as local and overseas consumers. 20
Mariner South – Natural Gas Liquids • Export NGLs from Gulf Coast: • Joint project between SXL and Lone Star (ETP/RGP) • Project originates at Lone Star’s fractionation facility in Mont Belvieu • An SXL pipeline would transport to Nederland Terminal for exporting • Comparable to Mariner East • Received sufficient commitments to proceed • Fee-based income • 1Q15 projected start-up • Excellent example of synergies within Energy Transfer family Mariner South NGLs from Mont Belvieu to Nederland 21
Summary • Geographically diverse asset base and strong business fundamentals • Commitment to Investment Grade credit rating • Flexible capital structure to support growth and distribution coverage • Experienced management team • Excellent prospects for future growth 22
Distributable Cash Flow (DCF) Definition (1) Restated DCF reflects SXL’s cash dividends received from unconsolidated affiliates (2) Restated DCF reflects SXL’s ownership share (%) of consolidated joint venture DCF A-4
2008-2012 DCF (New Definition) (1) Excludes non-cash amortization of fair value adjustment on long-term debt ($6 million in 2012) A-5
Joint Venture Ownership Consolidated Affiliates (JVs): Unconsolidated Affiliates (JVs): Undivided Interest JV’s: Bold - denotes operator * Operated by Explorer’s employees ** Operated by Wolverine’s employees A-6
Historical Financial Results ($MM) Note: The Partnership's definition of Adjusted EBITDA and DCF was revised beginning in the fourth quarter 2012. Prior period results have been recast to conform to the current presentation • * Excludes major acquisitions A-7
SXL Non-GAAP Financial Measures ($MM) • Management of the Partnership believes Adjusted EBITDA and distributable cash flow information enhances an investor's understanding of a business’s ability to generate cash for payment of distributions and other purposes. Adjusted EBITDA and Distributable Cash Flow do not represent and should not be considered alternatives to net income or cash flows from operating activities as determined under United States generally accepted accounting principles (GAAP) and may not be comparable to other similarly titled measures of other businesses. Historical amounts presented have been recast to conform to current period. Note: The Partnership's definition of Adjusted EBITDA and DCF was revised beginning in the fourth quarter 2012. Prior period results have been recast to conform to the current presentation A-8
Capitalization (1) Includes unamortized bond discount of ($2MM) (2) In accordance with purchase accounting, the Partnership's Senior Notes were accounted for at fair value upon the closing of Energy Transfer's acquisition of the Partnership's general partner. At 6/30/13, there was $131MM of net unamortized fair value adjustments, which includes $12MM of amortization which was recognized as a reduction of interest expense during 1H13. (3) In accordance with purchase accounting guidance, the components of the Partnership's consolidated equity balance were adjusted to fair value and resulted in an increase in consolidated equity of $4.8 billion upon the closing of Energy Transfer's acquisition of the Partnership's general partner. A-9
Debt Maturity Schedule at 6/30/2013 ($MM) 6.13% 4.65% 3.45% 6.10% 4.95% 6.85% 8.75% 5.50% Note: Excludes Revolver borrowings A-10
Debt to Adjusted EBITDA • Note: Adjusted EBITDA reflects last twelve months for the period ended. • Total Debt at 12/31/12 and 6/30/13 does not include unamortized fair value adjustments A-11
Debt to Adjusted EBITDA ($MM) (1) In accordance with purchase accounting guidance, the Partnership's Senior Notes were adjusted to fair value (“FV”) upon the closing of Energy Transfer's acquisition of the Partnership's general partner in October 2012. A-12
Revolver – Credit Facilities ($MM) Credit facilities include accordion features to expand borrowings to a total of $935MM ($250MM accordion on the $350MM facility and $100MM accordion on the $200MM facility) The $350MM and $200MM facilities have a maximum Debt/EBITDA of 5.0x (flexed to 5.5x during an acquisition period) A-13
Crude Oil Pipeline System • 34% of total EBITDA for the year ended December 31, 2012 • Approximately 4,900 miles of crude oil trunk lines located in the Southwest and Midwest U.S. • Approximately 500 miles of gathering lines • 60.3% controlling interest in West Texas Gulf Pipeline, a 580-mile crude oil pipeline • 91.0% controlling interest in Mid-Valley Pipeline, a 990-mile crude oil pipeline A-14
Crude Oil Acquisition and Marketing • 29% of total EBITDA for the year ended December 31, 2012 • Crude truck fleet of approximately 250 trucks • Purchase crude oil at the wellhead from producers and in bulk from aggregators at major pipeline interconnections and trading locations • Wellhead volumes over 300,000 barrels per day from approximately 4,000 producers in nineteen states and the Gulf of Mexico, with the majority of purchases being made in Oklahoma, Kansas, Texas, New Mexico, Michigan, North Dakota, and Louisiana • Storing inventory during contango market conditions – maintain balanced book to mitigate commodity risk • Transporting crude oil on our pipelines and trucks or when necessary or cost effective, pipelines or trucks owned and operated by third parties A-15
Terminal Facilities • 28% of total EBITDA for the year ended December 31, 2012 • Nederland, TX Crude Oil Terminal - One of the largest onshore crude facilities in U.S. • 22 million barrel capacity currently • Eagle Point, NJ Crude Oil and Refined Products Terminal • 5 million barrel capacity for crude oil and refined product storage • Pipeline and rail connections with import/export capabilities • Marcus Hook Industrial Complex • Pipeline, rail and trucking connections with import/export capabilities • Five underground NGL storage caverns • Refinery Terminal Facilities with combined 6 million barrel capacity • Serve Philadelphia area refineries • Over 40 active Refined Products Marketing Terminals located in 11 states with a combined capacity of 8 million barrels • Inkster, MI LPG Terminal with a capacity of 1 million barrels • Total terminal capacity of approximately 46 million barrels • Patented technology to blend butane into gasoline A-16
Refined Products Pipeline System • 9% of total EBITDA for the year ended December 31, 2012 • Refined products pipeline system (approximately 2,500 miles), located in the Northeast, Midwest and Southwest U.S. • Equity interest in four product pipelines • Explorer (9.4%) • West Shore (17.1%) • Wolverine (31.5%) • Yellowstone (14.0%) • 83.8% controlling interest in Inland Pipeline, a 350-mile refined products pipeline system A-17