Download
1 / 52
770 likes | 1.75k Vues
Introduction to Systematic Review and Meta-Analysis. VA Greater Los Angeles Healthcare System David Geffen School of Medicine at UCLA UCLA School of Public Health CURE Digestive Diseases Research Center UCLA/VA Center for Outcomes Research and Education (CORE). Brennan Spiegel, MD, MSHS.

E N D
Introduction to Systematic Review and Meta-Analysis VA Greater Los Angeles Healthcare System David Geffen School of Medicine at UCLA UCLA School of Public Health CURE Digestive Diseases Research Center UCLA/VA Center for Outcomes Research and Education (CORE) Brennan Spiegel, MD, MSHS
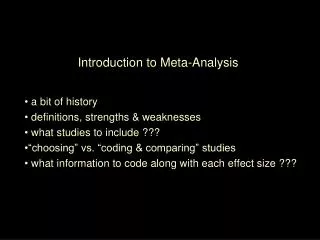
Objectives • Define and discuss “systematic review” • Contrast with “narrative review” • Describe the 4 components of appropriate question • Define steps for a successful search strategy • Review construction of evidence tables • Define and discuss “meta-analysis” • Describe calculations of summary estimates • Review how to evaluate for heterogeneity • Define fixed versus random effects models • Describe “funnel plots” for publication bias
Purposes of Systematic Review and Meta-Analysis • Combine data from multiple studies to arrive at summary conclusion • Calculate summary estimate of effect size • May overcome Type II error • Test for and explain heterogeneity • Test for publication bias • Inform decision models
Some Basic Premises • All meta-analyses must begin with a systematic review • Knowledge and application of statistical models cannot overcome inadequacies in qualitative systematic review • Qualitative approach is primary – quantitative approach is secondary
Decision Analysis and Systematic Review If decision analysis is the engine for making decisions under conditions of uncertainty, then systematic review provides the fuel to run the engine.
The Nature of Meta-Analysis “Meta-analysis should not be used exclusively to arrive at an average or ‘typical’ value for effect size. It is not simply a statistical method but rather a multicomponent approach for making sense of information.” • Diana Petitti, in Meta-Analysis, Decision Analysis, and Cost-Effectiveness Analysis, Oxford U Press 2000
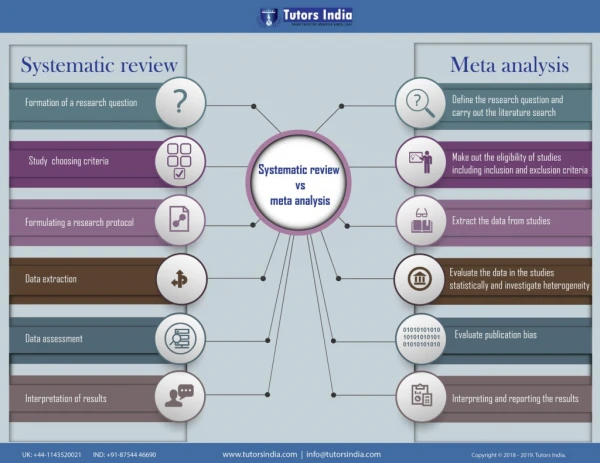
Systematic versus Narrative Review Adapted from Mulrow C, Cook D: Systematic Reviews; ACP Press 1998
Steps to Systematic Review Step 1 Define focused question Step 2 Define inclusion / exclusion criteria Step 3 Develop search strategy Step 4 Identify databases to search Step 5 Run search and abstract data Step 6 Compile data into evidence tables Step 6 Pool data Step 7 Interpret data
Four Elements of a Systematic Review Question • Type of person involved • Type of exposure experienced • Risk factor • Prognostic factor • Intervention • Diagnostic test • Type of control with which the exposure is being compared • Outcomes to be addressed Adapted from Mulrow C, Cook D: Systematic Reviews; ACP Press 1998
Exposure Outcome Example of Inadequate Question Does smoking cause lung cancer?
Outcome Exposure and Type of Person Control Better Question What is the relative risk of… lung cancer… in cigarette smokers… compared to non cigarette smokers?
Inadequate Question Are SSRIs, like Prozac, effective for depression? BetterDo SSRI improve health related quality of life in patients with depression compared with Elavil?
Feels Better Decision Node Does not Feel Better Depression Chance Nodes Feels Better Does not Feel Better
Developing Inclusion / Exclusion Criteria • Think of each study as a patient in an RCT • Must carefully specify inclusion and exclusion criteria to include in the study • Criteria should mirror carefully formulated question • Criteria should strike a balance in scope – avoid being too narrow or too broad • Make sure you target clinically relevant outcomes • Consider limiting to RCTs if possible
Considerations for Inclusion / Exclusion Criteria • Definition of target disease/condition • Stage or severity of condition • Patient sub-groups (age, sex, symptoms) • Population or setting (community, hospital) • Intensity, timing, or duration of exposure • Method of delivery (e.g. group therapy or individual therapy, oral or IV, etc) • Type of outcome (survival, HRQOL, adverse events) • Study design (experimental vs. observational; randomized vs. unrandomized)
Search Strategy Principles • Balance sensitivity with specificity • Highly sensitive search strategy may yield untenable number of titles by casting the net too widely • Highly specific search may yield too few titles and miss key articles by failing to cast a wide enough net • Said another way: “The overall goal of any search strategy is to identify all of the relevant material and nothing else.” • Diana Petitti, in Meta-Analysis, Decision Analysis, and Cost-Effectiveness Analysis, Oxford U Press 2000
Components of Search Strategy • Select target databases • US National Library of Medicine (MEDLINE) • EMBASE • “Fugitive” or “gray” literature • Cochrane Database of Systematic Review • Determine language restrictions • Establish time horizon for search • Operationalize targeted material with MeSH terms, text words (tw), and publication types (pt) • Operationalize excluded material and set after “NOT” operator
Example of Defining the Search Strategy 1 AND 2 NOT 3 Spiegel et al. Am J Med 2006
Another Example Spiegel et al. Alim Pharm Ther 2007
Example Search Strategy Spiegel et al. Arch Int Med 2001
Example Flow Diagram Spiegel et al. Arch Int Med 2001
Other Best Practices for Systematic Review • Identify titles, abstract, and manuscripts in 3 separate steps • Two reviewers search in tandem • Test set for training • Target high inter-rater reliability (k>0.7) • Develop standardized abstraction form for manuscript review • Transfer data onto evidence tables
Example of Data Abstraction Using Evidence Tables Spiegel et al. Am J Med 2006
Another Example Spiegel et al. Arch Int Med 2001
Evaluating Study Quality Jadad et al. Control Clin Trials 1996
nU nE NE NU = nE = nE NE NE RiskExposed RiskUnexposed Abstracting Data: 2x2 Table Exposed Unexposed Event NE - nE NU - nU No Event
Abstracting Data: 2x2 Table Exposed Unexposed B A Event C D No Event OR = AD / BC
Before you Combine Data • Look at the studies you’ve collected. Ask yourself, are they qualitatively similar in terms of 4 key characteristics: • Patient population • Exposure • Comparision group • Outcome
Before you Combine Data • Test for statistical evidence of heterogeneity • Cochrane’s Q statistic • I2 statistic • Measure degree of between-study variance • Wider the variance, higher the heterogeneity • Tests to see if you are combining “apples” and “oranges”
Cochrane’s Q Statistic • Tests the sum of the weighted difference between the summary effect measure and the measure of effect from each study • Compared against c2 distribution with k-1 degrees of freedom, where k=N of studies • Null hypothesis is that studies are homogeneous • Test has low sensitivity for detecting heterogeneity, especially when small N of studies – most use p<0.1 for significance
Visual Evidence of Heterogeneity Juni et al. Lancet 2004
I2 Statistic • Improves upon Q statistics because less conditional on sample size of studies • Describes the percentage of total variation across studies that is due to heterogeneity rather than chance. • I2 calcuation based on Q as follows: I2 = 100% x (Q-df) / Q Higgins et al. BMJ 2003;327
Interpreting I2 Statistic Range of 0-100% 0-25% = “Low” Heterogeneity 26-50% = “Moderate” Heterogeneity >50% = “High” Heterogeneity Higgins et al. BMJ 2003;327
What if there is Heterogeneity? • More important to explain heterogeneity than to force a summary estimate • Some turn to “random effects model” (more soon – not a good solution for heterogeneity) • Can explain heterogeneity through various mechanisms: • Perform sensitivity analyses stratified by key study characteristics • Perform meta-regression if sample size permits
Example of Sub-Group Analyses Watson et al. Curr Med Res Opin 2004
Fixed vs. Random Effects Models • Two types of statistical procedures to combine data from multiple studies: • Fixed effects models • Mantel-Haenszel Method • Peto Method • Random effects models • DerSimonian & Laird Method
Fixed Effects Models • Inference is conditional on the studies actually done – i.e. the studies at hand • Assumes there are no other studies outside of the group being evaluated • Focuses on “within study variance,” which assumes a fixed effect in each study with a variance around the study • Weight of each study is thus driven by sample size
Random Effects Models • Inference is based on the assumption that studies in analysis are random sample of larger hypothetical population of studies • Assumes there are other studies outside of the group being evaluated • Focuses on both “within study variance” and“between study variance” • Heterogeneity driven by 2 factors: random variation of each study around fixed effect, and random variation of each study compared to other studies
Within Study Variance Between Study Variance
More on Fixed vs. Random Models • Fixed effects model answers question: “Did the treatment produce benefit on average in the studies at hand?” • Random effect model answer question: “Will the treatment produce benefit on average?”
More on Fixed vs. Random Models • Random effects model usually more conservative than fixed effects model • Random effects usually has narrower confidence intervals • When between-study variance is large, within study variance becomes relatively less important, and large and small studies tend to be weighted equally • Fixed effect is special case of random effect in which between-study variance is zero • If there is no heterogeneity, then fixed and random effects models yield similar results
Random Effects Model as Solution for Heterogeneity “The use of the random-effects model is not a defensible solution to the problem of heterogeneity… When there is lack of homogeneity, calculating a summary estimate of effect size is of dubious value… Random effects models should not be used to ‘adjust for’ or ‘explain away’ heterogeneity. The main focus should be on trying to understand sources of heterogeneity.” - Diana Petitti
Where wi = 1 / variancei ORi = ai di/ bi ci n W = Swi i=1 Mantel-Haenszel Method n Weighted Mean OR = Swi*ORi / W i=1
Coxibs vs. NSAIDS: Dyspepsia Forest Plot Spiegel et al. Am J Med 2006
Running Meta-Analysis in STATA Spreadsheet set-up: Gen n_No_Event_Group_A=N_Group_A-n_Event_Group_A Gen n_No_Event_Group_B=N_Group_B-n_Event_Group_B Metan n_Event_Group_A n_No_Event_Group_A n_Event_Group_B n_No_Event_Group_B, rr fixed xlab (.8,1,2) texts(5) label(namevar=study)
Publication Bias • Editors and journal readers like big, positive studies • Small, negative studies are inherently less exciting or publishable • When small negative studies are suppressed, there is an artificially inflated effect
Symmetric Funnel Plot Sample Size Effect Size
Asymmetric Funnel Plot Sample Size Effect Size
Asymmetric Funnel Plot Sample Size Effect Size
Larger Effect Study Effect (Log Odds) Smaller Effect Larger Studies Study Size (SE) Smaller Studies