Download
1 / 10
100 likes | 177 Vues
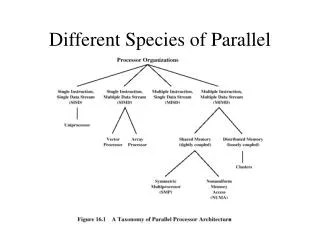
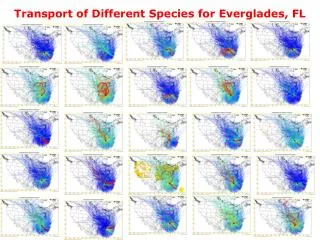
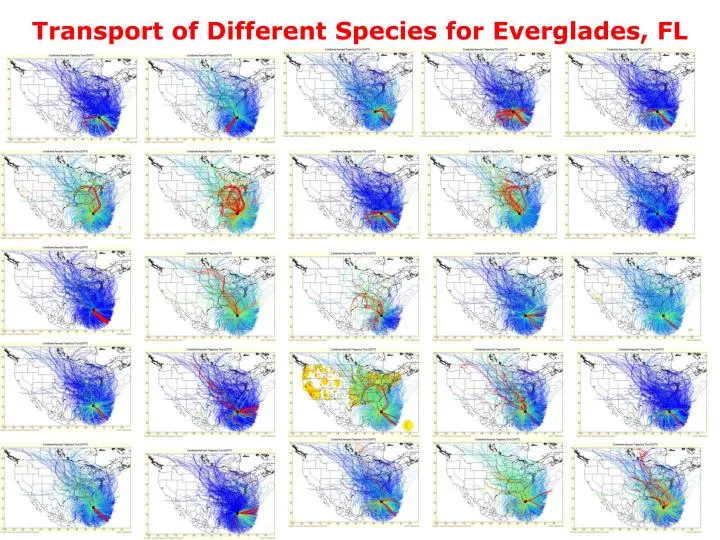
Transport of Different Species for Everglades, FL. Transport of SEf to Different Sites. Transport of NO3f to Different Sites. Sulfate Transport to BIBE, GRSM and LYBR. All Data. 80-100 Percentile. 0-20 Percentile. Big Bend, TX. Great Smoky, TN. Lynbrook, VT. GRSM SO4f Warm-Cold Season.

E N D
Sulfate Transport to BIBE, GRSM and LYBR All Data 80-100 Percentile 0-20 Percentile Big Bend, TX Great Smoky, TN Lynbrook, VT
GRSM SO4f Warm-Cold Season Warm - April-September Cold - October-March 80-100 Percentile 80-100 Percentile 0-20 Percentile 0-20 Percentile
Sulfate Transport Pattern on 2004-07-20 All Data SO4 > 5 SO4 > 15
Average Concentration of Different Species -DKenski Metricyou guess the species
OCf Concentration Field (DKenski Metric) Avg. 98 Percentile Avg. 95 Percentile Avg. 90 Percentile Avg. 80 Percentile Average, All Data
Parameter (expression, percentile, all values) (expression, percentile, all values) Location loc_code, loc_codes, loc_range, all_locations Time datetime, datetime_list datetime_range, all_dates