Download
1 / 14
140 likes | 258 Vues
O CEAN D ATA S YSTEMS Presents Dream Report 3.2. User Friendly Reporting Software for Continuous & Batch Processes. Introduction. Dream Report™ is the first integrated Reporting software solution for Industrial Automation It’s the simplest solution available in the market

E N D
OCEAN DATA SYSTEMSPresentsDreamReport 3.2 User Friendly Reporting Software for Continuous & BatchProcesses
Introduction • Dream Report™ is the first integrated Reporting software solution for Industrial Automation • It’s the simplest solution available in the market • It’s design for Both Continuous & Batch processes • It Generates and Distributes automatically PDF Reports • It exports easily and automatically Data to Excel Do U know that ? Dream Report is the simplest solution to do reports
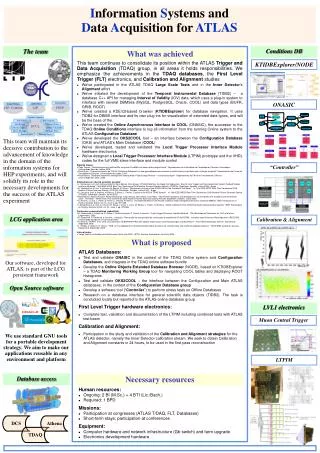
Product Architecture Do U know that ? • Dream Report is a complete solution enabling all together: Dream Report licensing is based on Number of Tags To minimize investment Web Portal File Server eMail Printers 5 – Report Generation & Distribution • Automatic Mode • - On Schedule • On Event • Manual Mode • Select Report • Change period or select batch • Generate new report 4 – Report Design Dream Report - To create state of the art reports - To Define Reports Templates 3 – Data Extraction & Analysis List of statistics : Min, Max, Average, Current, Integral, Duration, Counter, SQL commands, free Mathematical Calculation…To be displayed in multiple Views:Tables, Bars, Charts, Pies… 2- Data Logging Dream Report logger can archive Statistics but also real time data in any standard database - SQL Server - MySQL - Oracle - Access - … 1 – Data Collection Real time data collection - OPC DA-AE - Specific Drivers (scada, Plc…) Historian connection - OPC HDA - ODBC - OLE Equipments – Machines – Fabs - Buildings K A F C
Product Concept Do U know that ? Dream report can be used by anyone. Only 1 day training is enough to start Step 1 Configure project with “Dream Report Studio” Studio Step 2 Execute it with “Dream Report RUN TIME” Run time
More about Data Collection Do U know that ? ODS develops communication drivers for Oems and Partners DreamReport DreamReport PLC I/O Scada DCS Historians • Dream Report collects data from multiple heterogeneous Data Sources: • I/O, PLC, Scada, DCS, databases… • Dream Report stations can exchange and leverage their data • Dream Report can run independantly or be installed with any manufacturing application
Data Logging Do U know that ? You can log data on any standard database (SQL server, MySQL, Oracle, Access…) • Dream Report integrates a powerful historian, to log data from : • Any Real Time Sources connected • Dream Report Statistics Those data can be used in reports or be shared by any other external application In this case Dream Report acts as an E.I.I(*) application *Enterprise Information Integration (EII) is a new technology allowing companies to combine data from disparate sources into one single application To log Clean and Accurate Data, users can define multiple Groups and adjust: - Record Rate - Record Conditions
User Friendly Designer Studio Did U see that ? No script, no macro, just fill the dialog box. That’s it ! With Dream Report Studio, users can define nice templates with Backgrounds, Logos, images Dream Report doesn’t require any IT or programming skills. Configuration is done through simple interfaces and friendly dialog boxes.
Time definition To extract Data, users must select the time Period (Start period – End period) To respond to all markets needs Dream Report supports 3 type of time definition: • Absolute/Relative Date & Time Enable to mix absolute time (ex: Jan 1st 2006) and relative time (Day=0, HH:MM:SS=00:00:00) This option enable for example to extract the total duration of a motor since it was installed • Fixe Period Enable to select predefine configurable periods like The last or the current: Minute(s), Hour(s), Day(s), Week(s), Month(s), Quarter(s), Year(s) • Bacth Period In the production industry the start and the end period is saved on a tag named the batch tag. Dream report enable to define multiple batches and to set as a period any tag.
Data Extraction STEP Table Bar Graph Pie Graph Chart Data Table SQL TABLE Alarm Table Dream report Object Library enables to display in multiple views process metrics & analysis Statistical Object : To extract Current value , Last, Min, Max, Average, Sum, Duration, Up, Down, Availability, Deviation, … Compound Object: enables to select predefine statistics and extract easily Min, Max, Sum and the Average Expression Object: to do calculation based on Trigonometric, Mathematical and Boolean instructions Table of Data: enable to extract and display any data on a table Table of Alarms: enables to define alarm filters groups and display it in a pre-formatted table SQL Table: users define their SQL Query and this object builds the table automatically Statistical Table: User can select any period, define a step and select the statistics to be calculated and displayed Free Table: enables to build customized tables mixing text, dates and statistics Pie Graph: enables to compare and display in a nice pie alarms or statistics (current, last, Min, Max, Average,…) Bar Graph: enables to display by period alarms or statistics in a nice Bar graph Charts: enables to display multiple statistics in nice Charts Insert Date Insert Page Insert Report Name Insert Project Name
Proactive Report Generation and Distribution Do U know that ? Each reports has is own recipient list and can be sent anywhere ! • Each report has its own settings for generation and distribution. • Generation: • Reports can be automatically generated • On Schedule • On Condition • Reports can be generated manually • Distribution: • Reports can be automatically distributed • Via email to their recipient list • Printed over the network • Saved on any file server • Export to Excel file • Publish in Dream report Web Portal
Dream Report Web Portal Do U see that ? Anyone can get its PDF reports over a standard web browser • The goal is to access to any report from any site easily and fast.
Dream Report Web Portal Do U see that ? You Just have to click to access to any archived report • Dream Report Web Portal is ideal for distributing and sharing reports over the intranet/internet. • Password Protected it displays only authorized reports • Users can access to any reports archived • Users can change period settings and get immediately new updated report on demand.
Markets and References Dream Report is used in all markets • Automotive • Building automation • Chemical Industry • Device Management • Facilities • Food & Beverage • Manufacturing • Oil & gas • Pharmaceutical • Power energy • Water • Waste water • … Resellers ODS distributes its products worldwide through dedicated partners and resellers References • Airbus • Arc Informatique • Afcon • Biomérieu • Citigen • Cogema • Cyprus Cement • Emerson • Eon • Europhos • Eurotherm • De Smet • Gaz de France • IBM • Jumo • Nestlé • Port de Marseille • Rhom & Hass • Regin Controls • Saint Gobain • Sauter BC • Schneider Electric • STGS Water • Techno Trade • Xsys Print • … Contact us Sales: sales@hollis-tech.com Call at: 603-577-8958
Bye Click here to download and try immediately Dream Report