Download
1 / 26
260 likes | 398 Vues
The Songs of the Stars and the Part that Willy Sings Bob Cadmus Grinnell College. Slides with yellow text were added later to make the web version more self-explanatory. It was an honor to be able to work with Willy and his group (see next slide).

E N D
The Songs of the Starsand thePart that Willy SingsBob CadmusGrinnell College
Slides with yellow text were added later to make the web version more self-explanatory.
It was an honor to be able to work with Willy and his group (see next slide). Willy contributed to my professional development in several ways: Research -- High standards. I think of Willy when I explain to my students the importance of plotting data while an experiment is in progress. Writing -- I probably learned more about writing from Willy than from any of my English teachers. “If it’s possible to misread it, then it’s not clear enough.” Teaching -- Opportunity to participate in the development and teaching of the Physics in the Arts course. Taught me that teaching is fun.
The Haeberli Group in the Tandem Control Room (about 1971)
The transition to astronomy at Grinnell: Worked as post doc with Tom Clegg at UNC Decided that I wanted to teach at a liberal arts college where both undergraduate teaching and research were valued Grinnell College is such a place so I went there as a nuclear physicist Soon realized the potential benefits, both for me and for the college, of an astronomy program at Grinnell so I retrained myself, built an observatory, and developed an astronomy research program Grinnell’s observatory supports activities ranging from preschoolers looking at the moon to NSF-funded research that has been published in (for example) the Astrophysical Journal.
Astronomy at Grinnell College ************************* Instruction - no major, but students go to graduate school Research - variable stars, mostly Outreach - various public programs
Optical astronomy research at Grinnell: (There is now research in g-ray astronomy as well.) Need a research area that can’t be done better at large, visitor-oriented observatories. Work on long period variable stars is a good choice because there is interesting science there, a large telescope is not required, and we have access to the large amount of telescope time that is required. The essential nature of the work is to measure the changes in brightness, color, and spectrum for the program stars over a long period of time and then interpret those data in terms of the underlying stellar physics. This sort of project provides good research opportunities for undergraduate students.
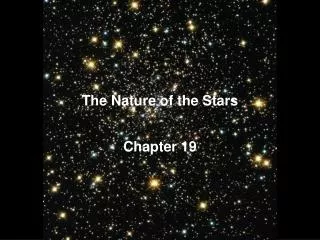
The Songs of the Stars ************************* • Semiregular variable stars were once like the sun, but are dying. • They pulsate, producing quasiperiodic light variations. • The Fourier spectra of the light variations are related to the modes of pulsation.
The next three slides show brightness and color data (light curves) for 3 of the 33 stars in our observing program. The entire set of data includes a wide variety of light curve characteristics. The data presented here (not the full set for each star) span about 12 years. RV And -- Variations in amplitude, frequency, and Fourier composition. We believe that this data shows that the star changes its mode of pulsation. U Per -- Little interesting behavior. As with RV And, there is little color variation. RS Cyg -- Interesting dips in peaks and strong color variation. We hope that our spectroscopy data (later slide) will help us understand these phenomena.
The Light Curve for RV Andromedae Brightness vs. Time Above; Color vs. Time Below
The Light Curve for U Persei Brightness vs. Time Above; Color vs. Time Below
The Light Curve for RS Cygni Brightness vs. Time Above; Color vs. Time Below
We are particularly interested in identifying the modes of pulsation of these stars and understanding how energy flows among the modes. One way to do this is to investigate how the Fourier spectrum of the light curve changes over time. To the extent that the various frequency components are related to the modes (probably not strictly true in all cases), the strengths of the Fourier components reveal the extent to which the star is pulsating in each of its various modes. This mixture of frequencies is similar to the frequency composition of a musical tone and is what I mean by the “songs of the stars.” The next slide shows the variation of the Fourier spectrum of the light curve of RV And over time. Reds and yellows represent the greatest strength. The changes in the relative strengths of the components are clearly visible. This plot (frequency increasing upward, time increasing to the right) is roughly like the musical score for the star.
Other Projects - Spectroscopy ************************* • Chaos models • Multi-wavelength collaborations • Spectroscopic monitoring of SR stars • Spectroscopic monitoring of active • galactic nuclei (black hole eclipses)
Elaboration on the previous slide: Chaos -- In collaboration with others we have published a paper supporting the conclusion that at least some of the behavior of these stars is the result of chaotic processes. Multi-wavelength -- Several papers have resulted from comparisons between our optical data and radio, IR, or UV data from other astronomers. Spectroscopic monitoring of SR stars -- The time dependence of spectral features may shed light on the physics behind some odd stellar behavior, especially for RS Cyg (more on a later slide). Spectroscopic monitoring of active galactic nuclei -- This project involves an attempt to discover clumpiness in the accretion disks surrounding supermassive black holes (more on a later slide).
The next slide shows the spectrum of RS Cyg, the star with the dips in its light curve peaks and strong color variations. We have a large set of such spectra covering a number of pulsational cycles that will be used to look for correlations between the photometric behavior and the behavior of specific spectral features. The narrow Balmer emission lines are produced by shock waves in the outer atmosphere of the star. In other spectra the Na D absorption line is even stronger than it is here.
The next slide does not show research data, but rather the sort of data that Grinnell students in the Modern Physics course take as part of an experiment in which they determine the age of the universe almost entirely from their own observations. The image is a raw CCD frame of the galaxy spectrum to which a plot of the spectrum and various explanatory notes have been added. The redshift of the galaxy’s Ha line relative to that of the local standard is easily measurable. The students obtain an estimate of the distance to the galaxy from an image that they acquire. From these data they can calculate the value of the Hubble constant and from that, an estimated value of the age of the universe.
The spectrum of the active galaxy NGC 4151 shown on the next slide is part of a new project to investigate whether the periodic dimming of the light from the region near the black hole at the center of this galaxy is the result of obscuration by an orbiting clump of material. The Ha line, which is substantially Doppler broadened, may come from gas that is at a smaller radius while the narrower O III line may arise in gas that is farther out. The variations in the strengths of these lines over time, and the correlation of that data with the photometric data, may allow us to understand what is going on here.
Thanks Willy !


![The signs of the times (4) [Sings and Wonders/ miracles]](https://cdn1.slideserve.com/2115200/the-signs-of-the-times-4-sings-and-wonders-miracles-dt.jpg)