Download
1 / 18
180 likes | 314 Vues
Presented 2005, Society for Risk Analysis Annual Meeting

E N D
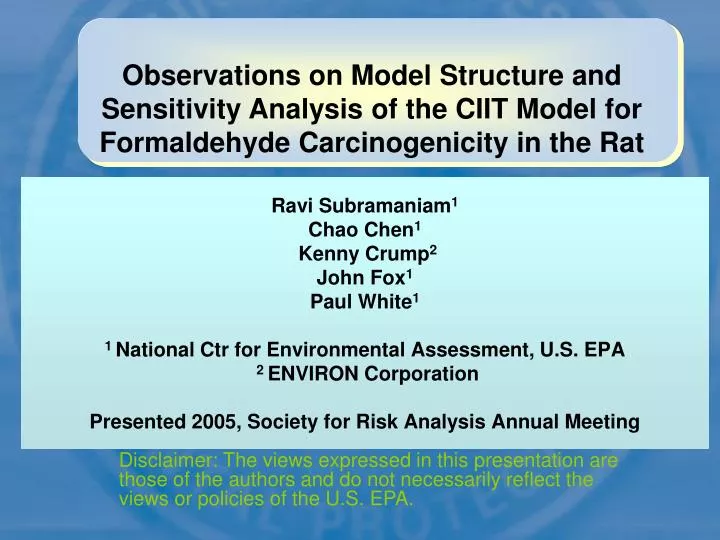
Ravi Subramaniam1Chao Chen1 Kenny Crump2John Fox1Paul White11 National Ctr for Environmental Assessment, U.S. EPA2 ENVIRON CorporationPresented 2005, Society for Risk Analysis Annual Meeting Observations on Model Structure and Sensitivity Analysis of the CIIT Model for Formaldehyde Carcinogenicity in the Rat Disclaimer: The views expressed in this presentation are those of the authors and do not necessarily reflect the views or policies of the U.S. EPA.
CIIT Risk Assessment for Formaldehyde • CIIT Centers for Health Research [Conolly et al. (2000, 2003, 2004); Kimbell et al. (2001)]developed a novel model for estimating respiratory cancer risk due to inhaled formaldehyde that made extensive use of data • CFD calculations of local formaldehyde flux • PBPK model of DNA protein cross-links (DPX) with formaldehyde • Tumor incidence in rats from two chronic inhalation bioassays • Labeling index data for estimating cell replication rates • Dual mode-of-action • Genotoxic and directly mutagenic • DNA protein cross-linking with formaldehyde (DPX) considered a surrogate for mutational pathway • Cytotoxicity-driven regenerative cell proliferation • EPA is evaluating the CIIT model for possible use in its IRIS risk assessment. Other organizations are also considering use of (or have used) this model. This poster lays out the issues that we believe need to be evaluated and better understood.
Key Model Predictions • De-minimus additional lifetime risk in humans (non-smokers) for continuous environmental exposures below 0.2 ppm • Zero maximum likelihood estimate (MLE) of the probability of formaldehyde-induced mutation per cell generation in the rat (µf) • Upper bound of 8 x 10⁻⁷ for µf per unit DPX concentration Presentations in this session do not address uncertainties related to modeling the extrapolation to human
Normal cells Schematic of CIIT 2-Stage Clonal Growth Model Formaldehyde in inhaled air (Site-specific flux from air into tissue from Dosimetry Model) (DPX) Cancer cell Initiated cells (delay) Tumor Nasal epithelium
Inputs to the 2-stage model • Local formaldehyde flux to nasal tissue obtained from CFD simulations • DPX concentrations in the nose as a function of location and time • Obtained from a PBPK model based on DPX concentrations measured at various exposuresat two different regions and one time point (3 hours) • Predicted DPX concentrations vary on an hourly basis Kimbell et al., 2001 Schematic of hourly variations (from Conolly et al., 2003)
Inputs to the 2-stage model (contd.) • Probability of mutation per cell generation • µ = µbasal + k x DPX • µbasal & k determined by fitting model predictions to tumor incidence data. Optimal value for k was found to be zero. • Tumor incidence – two rat bioassays combined • Kerns (1982) and Monticello (1996) • Control tumor incidence data: Concurrent + All NTP Historical Controls • Unit Length Labeling Index Data (ULLI) from two studies • ULLI = no. labeled cells per unit length of basement membrane examined • Pulse label data for early times of exposure, 1 day to 6 week (Monticello, 1991). 2-hour labeling by injection of tritiated thymidine • Continuous labeling data (Monticello, 1996) for 13 to 78 weeks exposure. 120-hour labeling using osmotic minipump
aN Flux (pmol/mm2-hr) Cell Replication Rates in CIIT Model • ULLI correlated to Labeling Index (LI) • from ULLI and LI measurements in Monticello (1990) for one exposure duration and two sites • LI related to normal cell replication rate (aN) • LI = 1 - exp(-2x aN x t) : Moolgavkar et al. (1992) • Formula used for 2-hour pulse and 120-hour continuous labeling data • Time Weighted Average (TWA) of aN over 5 Sites and various exposure times in the nose αmax aN • This range is 1/4th of maximum flux used in model, at 15 ppm. • aN for 9340 < flux < 39,000 is unknown. a(max flux)estimated by fitting model predictions to tumor incidence Flux (pmol/mm2-hr)
G is an extremely sensitive factor Optimal CIIT Model Structure for Initiated Cells • Normal (N) Cells described deterministically by a Gompertz growth curve • Initiated Cells (I) are given a “Growth Advantage” over N Cells. aI (flux) = G (flux) x aN (flux) • I Cell Death Rate (bI)= N Cell Division Rate (aN) -- assumed • For flux > 22,000 pmole/mm2/hr • I cells divide less rapidly than N cells • I cells die faster than they divide
Tumor Probability Exposure Concentration (ppm) Model Structure for Initiated Cells (Contd.) • Assumed model structure for I cells appears to be needed to allow CIIT model to simultaneously fit all tumor data • (Note: There are no data for I cells) • This model structure leads to intriguing results. Consider the difference between the 8th and 15th “flux bins” for various exposure concentrations • Flux bins in the CIIT model • Method of partitioning nasal surface by flux. Each bin (20 bins in total) is comprised of elements of the nasal surface that receive a particular interval of formaldehyde flux per ppm of exposure concentration. • Flux in a “bin” scales linearly with ppm. • Locations of elements comprising a flux bin are spatially fixed as exposure concentration (ppm) changes • Cumulative probability of tumor at time T, • P(T) = 1 - [1 – Pi(T)] • where Pi(T) is the tumor probability for flux bin “i”
Issues: Statistical Refinements Considered--NCEA Analysis-- • Model lumps animals dying of tumor together with serially sacrificed animals with tumors. The sensitivity of this assumption on model fit and parameter estimates needs to be examined • Survival and tumor rates in different (inhalation, drinking water, …) NTP bioassays may vary because of feed, housing, genetic drift. Predicted dose response curve and parameter estimates may be sensitive to combining all NTP controls with concurrent controls. • Model solutions are strictly valid only when variables are constant in time. Number of normal cells, body-weight and labeling index data vary in time. • See poster by Crump et al. in this session for exploration of above issues
Issues: Normal Cell Replication Data--NCEA Analysis-- • Large patterns of variability over nasal sites and exposure times in labeling index data • Examine sensitivity of low dose risk and parameter estimates to these variations • Can pulse and continuous labeling data be combined? • Moolgavkar (1992) formula for relating labeling index to cell division rate was derived for continuous labeling, not pulse labeling data • Cell replication rates measured at early times (6 weeks and less) of exposure may be important to the cancer process. • However, we do not know how to relate the pulse ULLI data for formaldehyde to cell division rates for use in the MVK cancer model • See poster by Fox et al. in this session for further elaboration of these issues • What is the impact of uncertainties in model structure and parameters on model inferences • On risk • On the role of formaldehyde-induced mutation
Tumor Risk and High Flux Regions • To what extent do “hot spots” of flux influence tumor risk? • Intermediate flux bins determine tumor risk • Risk is a nonlinear function of number of cells at risk and flux • Thus, risk estimates are not likely to be sensitive to numerical errors in flux estimates from higher flux bin numbers
Region of a extrapolation Model Estimated Cell Replication Rate • The function aN (flux) for 9,340 < flux < 39,000 pmole/mm2/hr is not experimentally determined. • amax = aN (flux=39,000) is an adjustable parameter determined by fitting model to tumor incidence • Uncertainty in this upward extrapolation needs to be evaluated • Most of the model fit to data falls in extrapolated region of flux • Increase in amax by 20% degrades fit to 6ppm curve and gives roughly 15% increased probability of tumor • Decrease in amax by 20% completely degrades fit to 10 ppm curve • Thus, optimal values of other parameters that determine low dose risk are very sensitive to amax
Issues: Initiated Cell Division and Death Rates--NCEA Analysis-- • On the variation of Initiated Cell replication and death rates with flux • Is it biologically likely that Initiatedcell replication rate will have a threshold or J-shape in dose? • Labeling data at lower doses is for collection of largely Normal cells. With the growth advantage function used in model, a threshold in dose or J-shape curve for aN (flux) results in a threshold or J-shape for the function, aI(flux). • The 2-stage model is extremely sensitive to aI. Therefore, monotonically increasing non-threshold curves for aI(flux) are also being explored. Alternate relationships we have explored so far do not fit the tumor incidence data well. • At high levels of formaldehyde flux, aI < aN and bI > aIappear to be necessary components of model structure in order to fit tumor data. Are these model structures biologically reasonable for formaldehyde? • Explore model characteristics when highest dose data is deleted
Conclusions • Extensive amount of data is available from rodent studies on formaldehyde • Two chronic bioassays, DPX data, labeling index studies, airflow studies • The CIIT model provides a conceptual framework to incorporate this data in risk assessment • Various uncertainties in this data and model structure need to be incorporated, so as to be able to calculate a plausible upper bound on risk and evaluate model inference on the role of formaldehyde-induced mutation • In ongoing work, we are carrying out various sensitivity analyses pertinent to key biological issues in the model
Acknowledgments • Rory Conolly • Julia Kimbell • Annie Jarabek • Paul Schlosser • Fred Miller • Danielle Devoney • Kathryn Guyton • Chad Thompson • Christopher Portier • Dale Hattis • George Lucier • Linda Hanna • Weihsueh Chiu
References • Conolly RB, Lilly PD and Kimbell JS. Simulation Modeling of the Tissue Disposition of Formaldehyde to Predict Nasal DNA-Protein Cross-Links in Fischer 344 Rats, Rhesus Monkeys, and Humans (2000). Environmental Health Persp 108, Supplement 5 • Conolly, R. B., Kimbell, J. S., Janszen, D., Schlosser, P. M., Kalisak, D., Preston, J., and Miller, F. J. (2003). Biologically motivated computational modeling of formaldehyde carcinogenicity in the F344 rat. Toxicological Sciences 75, 432-447. • Conolly, RB., Kimbell, JS., Janszen., Schlosser., Kalisak., Preston., and Miller (2004). Human respiratory tract cancer risks of inhaled formaldehyde: dose-response predictions derived from biologically-motivated computational modeling of a combined rodent and human dataset. Toxicological Sciences. • Hubal EA, Schlosser PM, Conolly RB, Kimbell JS. (1997). Comparison of inhaled formaldehyde dosimetry predictions with DNA-protein cross-link measurements in the rat nasal passages. Toxicol Appl Pharmacol. 143(1):47-55. • Kimbell JS, Overton JH, Subramaniam RP, Schlosser PM, Morgan KT, Conolly RB, Miller FJ. (2001) Dosimetry modeling of inhaled formaldehyde: binning nasal flux predictions for quantitative risk assessment. Toxicol Sci. 64(1):111-21. • Kimbell JS, Subramaniam RP, Gross EA, Schlosser PM, Morgan KT. (2001) Dosimetry modeling of inhaled formaldehyde: comparisons of local flux predictions in the rat, monkey, and human nasal passages. Toxicol Sci. 2001 64(1):100-10. • Kerns WD, Pavkov KL, Donofrio DJ, Gralla EJ, Swenberg JA. (1983). Carcinogenicity of formaldehyde in rats and mice after long-term inhalation exposure. Cancer Res. 1983 Sep;43(9):4382-92. • Monticello, T. et al. (1996). Correlation of regional and nonlinear formaldehyde-induced nasal cancer with proliferating populations of cells. Cancer Research 56, 1012-1022. • Monticello TM, Swenberg JA, Gross EA, Leininger JR, Kimbell JS, Seilkop S, Starr TB, Gibson JE, Morgan KT. (1996). Correlation of regional and nonlinear formaldehyde-induced nasal cancer with proliferating populations of cells. Cancer Res. 1;56(5):1012-22. • Monticello TM, Miller FJ, Morgan KT. (1991). Regional increases in rat nasal epithelial cell proliferation following acute and subchronic inhalation of formaldehyde. Toxicol Appl Pharmacol. 111(3):409-21. • Moolgavkar SH., Luebeck, EG. Interpretation of labeling indices in the presence of cell death (1992). Carcinogenesis, 13, 1007-1010. • Subramaniam RP, Richardson RB, Morgan KT, Kimbell JS. (2000). Computational fluid dynamics simulations of inspiratory airflow in the human nose and nasopharynx. Inhal. Tox 10:91-120.