Download
1 / 4
40 likes | 46 Vues
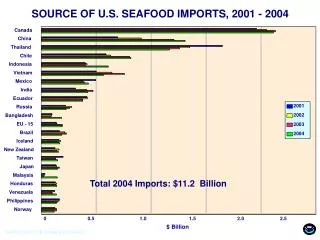
Trade Patterns U.S. Imports. Date last updated: December 8, 2017. DataPost. Federal Reserve Bank of San Francisco Education & Outreach. U.S. Imports by World Area and Selected Countries 2006 vs. 2016 Customs Value Totals ($billions). Source: Census Bureau & FRBSF Calculations

E N D
Trade PatternsU.S. Imports Date last updated: December 8, 2017 DataPost Federal Reserve Bank of San Francisco Education & Outreach
U.S. Imports by World Area and Selected Countries2006 vs. 2016 Customs Value Totals ($billions) Source: Census Bureau & FRBSF Calculations Note: Data are calendar-year totals of monthly, non-seasonally adjusted values DataPost www.frbsf.org/education/teacher-resources/datapost FRBSF Education & Outreach
Annotated Chart NotesU.S. Imports by World Area and Selected Countries2006 vs. 2016 Customs Value Totals ($billions) For imports, the value reported is the U.S. Customs and Border Protection appraised value of merchandise China: $288b in 2006 $463b in 2016 Import values from China increased 61% from 2006 to 2016 =100 x (462.6-287.8) 287.8 Source: Census Bureau & FRBSF Calculations Note: Data are calendar-year totals of monthly, non-seasonally adjusted values See PowerPoint file for country definitions and data source DataPost www.frbsf.org/education/teacher-resources/datapost FRBSF Education & Outreach
What Do You Think? • How would you describe the change in Japanese import totals from 2006 to 2016? (See slide 2) • Imports from China increased 61% from 2006 to 2016. Over the same time period, what was the percent change for the category “Rest of the World”? (See slide 3) • For any world area or country shown, did imports show a decrease in value from 2006 to 2016? (See slide 3) • What were the top three sources of U.S. imports in 2006? In 2016? (See slide 2) Visit FRBSF.org to learn more about U.S. trade. DataPost www.frbsf.org/education/teacher-resources/datapost FRBSF Education & Outreach