Download
1 / 1
10 likes | 95 Vues
A. 1. 2. 3. 4. 5. 6. 7. 8. 9. 10. 11. Rec 4. Rec 8. Rec 2 (Rec TL ). Recombination initiation sites. Rec 5. Rec 3. Rec 1 (Rec Nci I). Rec 6. Rec 7. B. -311 bp. -7 bp. -634 bp. -320 bp. -275 bp. -1 bp. -55 bp. 1. 2. 3. 4. 5. 6. 7. 8. 9. 10. 11. IVS2+1G>A.

E N D
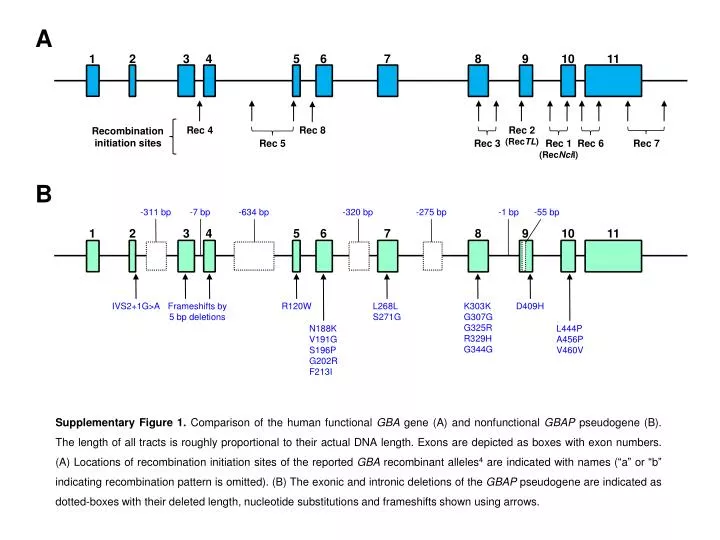
A 1 2 3 4 5 6 7 8 9 10 11 Rec 4 Rec 8 Rec 2 (RecTL) Recombination initiation sites Rec 5 Rec 3 Rec 1 (RecNciI) Rec 6 Rec 7 B -311 bp -7 bp -634 bp -320 bp -275 bp -1 bp -55 bp 1 2 3 4 5 6 7 8 9 10 11 IVS2+1G>A Frameshifts by 5 bp deletions R120W L268L S271G K303K G307G G325R R329H G344G D409H N188K V191G S196P G202R F213I L444P A456P V460V Supplementary Figure 1. Comparison of the human functional GBA gene (A) and nonfunctional GBAP pseudogene(B). The length of all tracts is roughly proportional to their actual DNA length. Exons are depicted as boxes with exon numbers. (A) Locations of recombination initiation sites of the reported GBA recombinant alleles4 are indicated with names (“a” or “b” indicating recombination pattern is omitted). (B) The exonic and intronic deletions of the GBAP pseudogene are indicated as dotted-boxes with their deleted length, nucleotide substitutions and frameshifts shown using arrows.