Download
1 / 12
330 likes | 956 Vues
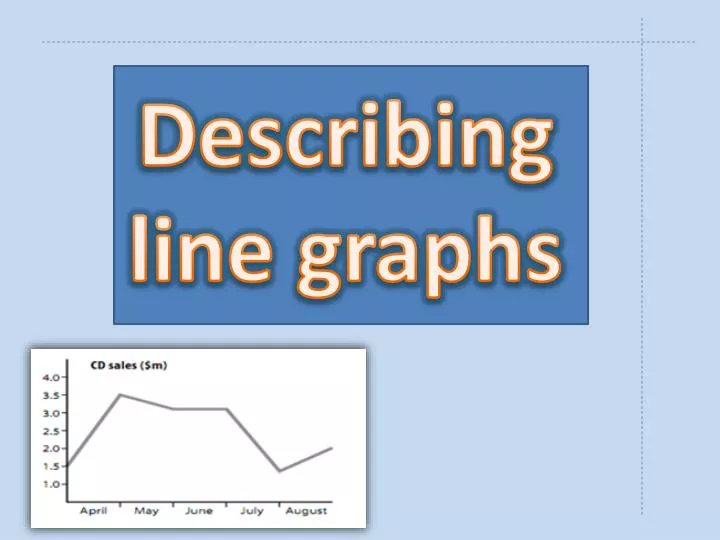
Describing line graphs. useful phrases used for describing increases and decreases in charts. Went up and down frequently: - Fluctuated widely Fluctuated a great deal Fluctuated mildly . Didn’t change: Remained steady Remained stable Stayed at this level Went up a little:

E N D
useful phrases used for describing increases and decreases in charts. Went up and down frequently: - Fluctuated widely • Fluctuated a great deal • Fluctuated mildly
Didn’t change: • Remained steady • Remained stable • Stayed at this level • Went up a little: • Increased slightly • Rose slightly • There was a small increase
Went up very quickly: -Increased dramatically - Rose sharply • There was a marked upward trend • Arrived at its highest point: • Reached a peak
Went down a little: • Decreased slightly • Dropped gradually • There was a small drop • There was a steady downward trend • Went down very quickly: • Decreased sharply • Dropped dramatically
There are two useful sentence structure for describing graphs. #[noun phrase]+ [verb]+ [adverb] For example: • The unemployment rate rose rapidly • The cost of living fell dramatically # [ there is/are]+ [noun phrase] For example: • There was a rise in unemployment. • there has been an increase in the cost of living.
Fractions can also be used to show the size of change over a certain period for example : • The cost of rent doubled in less than a year. • Birth rate have halved since the turn of the century. • By July the price of petrol had fallen by a third. • The number of school leavers going on to a university has risen by a quarter since 1980. Doubled - halved - tripled - a third - a quarter
Useful words and phrases for making approximations • For example, if real sales figures for oranges rose from 4000 kilos to 7850 kilos, you can say that orange sales almost doubled. • Other words for making approximations: Just over / slightly more than around / approximately just under / nearly
How to describe a line graph? To write a short description of this graph ask yourself the following questions: What exactly does the graph show? (Use the chart title to help you answer this question) What are the axes and what are the units? What changed? How much did it change? Answering these questions will help you to write a short description of this simple graph. Here is an example: This graph shows population change in Denmark from 1996 to 2007. Denmark's population grew steadily from 5.25 million in 1996 to 5.45 million in 2007, an increase of 200,000 people.
References: Essay Builder.(2008). Describing Line Graphs. Retrieved May6,2011,from http://www.essaybuilder.net/index.html